Unlock a world of possibilities! Login now and discover the exclusive benefits awaiting you.
- Qlik Community
- :
- Forums
- :
- Analytics
- :
- New to Qlik Analytics
- :
- Regression function and r squared
- Subscribe to RSS Feed
- Mark Topic as New
- Mark Topic as Read
- Float this Topic for Current User
- Bookmark
- Subscribe
- Mute
- Printer Friendly Page
- Mark as New
- Bookmark
- Subscribe
- Mute
- Subscribe to RSS Feed
- Permalink
- Report Inappropriate Content
Regression function and r squared
Hey,
do you know how to write a regression function and the r squared of the regression in the new Qlik Sense 3.2 SR3?
The way I used to do it in the old version is not working anymore.
The following is how i used to write the regression function.
R.ScriptEval('fitted.values(lm(.arg2 ~ .arg1))' , RegInnen, Avg(ADI_Skaliert))
regrads
Santana
- Mark as New
- Bookmark
- Subscribe
- Mute
- Subscribe to RSS Feed
- Permalink
- Report Inappropriate Content
This was something which worked for you in Qlik Sense?
R.ScriptEval('fitted.values(lm(.arg2 ~ .arg1))' , RegInnen, Avg(ADI_Skaliert))
- Mark as New
- Bookmark
- Subscribe
- Mute
- Subscribe to RSS Feed
- Permalink
- Report Inappropriate Content
yes that worked for me.
but it is much easier with the new version of Qlik sense.
now i've got this
R.ScriptEval('lm(q$Invest ~ q$RegInnen)$fitted' , Avg(ADI_Skaliert) as Invest, RegInnen)
and it works perfectly. The only problem is that I am not able to extract the r squared of the regression for this regression
Regrads
Santana
- Mark as New
- Bookmark
- Subscribe
- Mute
- Subscribe to RSS Feed
- Permalink
- Report Inappropriate Content
try:
R.ScriptEval('summary(lm(q$Invest ~ q$RegInnen))$r.square' , Avg(ADI_Skaliert) as Invest, RegInnen)
it brings the r square in R, but I wasn't able to handle the R return. I could plot a bar chart with dimension equal to record number.
- Mark as New
- Bookmark
- Subscribe
- Mute
- Subscribe to RSS Feed
- Permalink
- Report Inappropriate Content
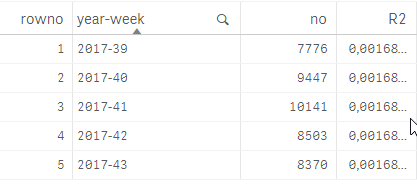
I confirm Rodolfo answer. The result however depends where you want to have your number - in table, chart per each row of the data or in text box (recommended). In tabel or in chart you need to use rep function to repeat it in every row:
R.ScriptEval('rep(summary(lm(q$Invest ~ q$RegInnen))$r.square,length(q$RegInnen))' , Avg(ADI_Skaliert) as Invest, RegInnen). This is my result for some numbers:
In text box you shall qoute it like this (I hope it works but I do not know exact form of your data below):
Aggr(R.ScriptEval('rep(summary(lm(q$Invest ~ q$RegInnen))$r.square,length(q$RegInnen))' , Avg(Total <RegInnen> ADI_Skaliert) as Invest, RegInnen),RegInnen)
And last, why not to use qlik function LINEST_R2? In this case it might work (for fitted values R is more comfortable).