Unlock a world of possibilities! Login now and discover the exclusive benefits awaiting you.
- Qlik Community
- :
- Forums
- :
- Analytics
- :
- New to Qlik Analytics
- :
- convert month name to number and use as measure
- Subscribe to RSS Feed
- Mark Topic as New
- Mark Topic as Read
- Float this Topic for Current User
- Bookmark
- Subscribe
- Mute
- Printer Friendly Page
- Mark as New
- Bookmark
- Subscribe
- Mute
- Subscribe to RSS Feed
- Permalink
- Report Inappropriate Content
convert month name to number and use as measure
Hi
I have 2 dimensions .one among that is month . I want to sue scatter plot but ,that chart needs 2 measures.So is it possible to convert month name to number and use as measure.
thanks
Prana
- Mark as New
- Bookmark
- Subscribe
- Mute
- Subscribe to RSS Feed
- Permalink
- Report Inappropriate Content
Hi,
Sure, Num(Month) but that Scatter Plot may result a bit strange...
Regards,
Luis
- Mark as New
- Bookmark
- Subscribe
- Mute
- Subscribe to RSS Feed
- Permalink
- Report Inappropriate Content
Hi,
try like to way to get month no from month text field. better share your mock data, we can try to help u
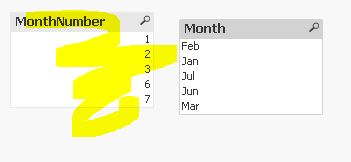
num(month(date#(Month,'MMM'))) as MonthNumber;
sample,
load *, num(month(date#(Month,'MMM'))) as MonthNumber;
load * Inline [
Month
Jan
Feb
Mar
Jun
Jul
]
Thanks,
Deva
- Mark as New
- Bookmark
- Subscribe
- Mute
- Subscribe to RSS Feed
- Permalink
- Report Inappropriate Content
Thanks Luis, I already tried that code, it works in the table but in the scatter plot I get " chart is not displayed due to undefined values".
- Mark as New
- Bookmark
- Subscribe
- Mute
- Subscribe to RSS Feed
- Permalink
- Report Inappropriate Content
Thanks Deva- I am using Qlik sense. And I am looking to modify at the visualization level. not the data model level.
- Mark as New
- Bookmark
- Subscribe
- Mute
- Subscribe to RSS Feed
- Permalink
- Report Inappropriate Content
Hi,
how your going to use month number as another measure? i don't think this output will give u the right o/p. better share the mock data we can help u.
for the month number extraction from month u also do it in front end just use this as calculated dimension or measure
num(month(date#(Month,'MMM')))
- Mark as New
- Bookmark
- Subscribe
- Mute
- Subscribe to RSS Feed
- Permalink
- Report Inappropriate Content
Hi,
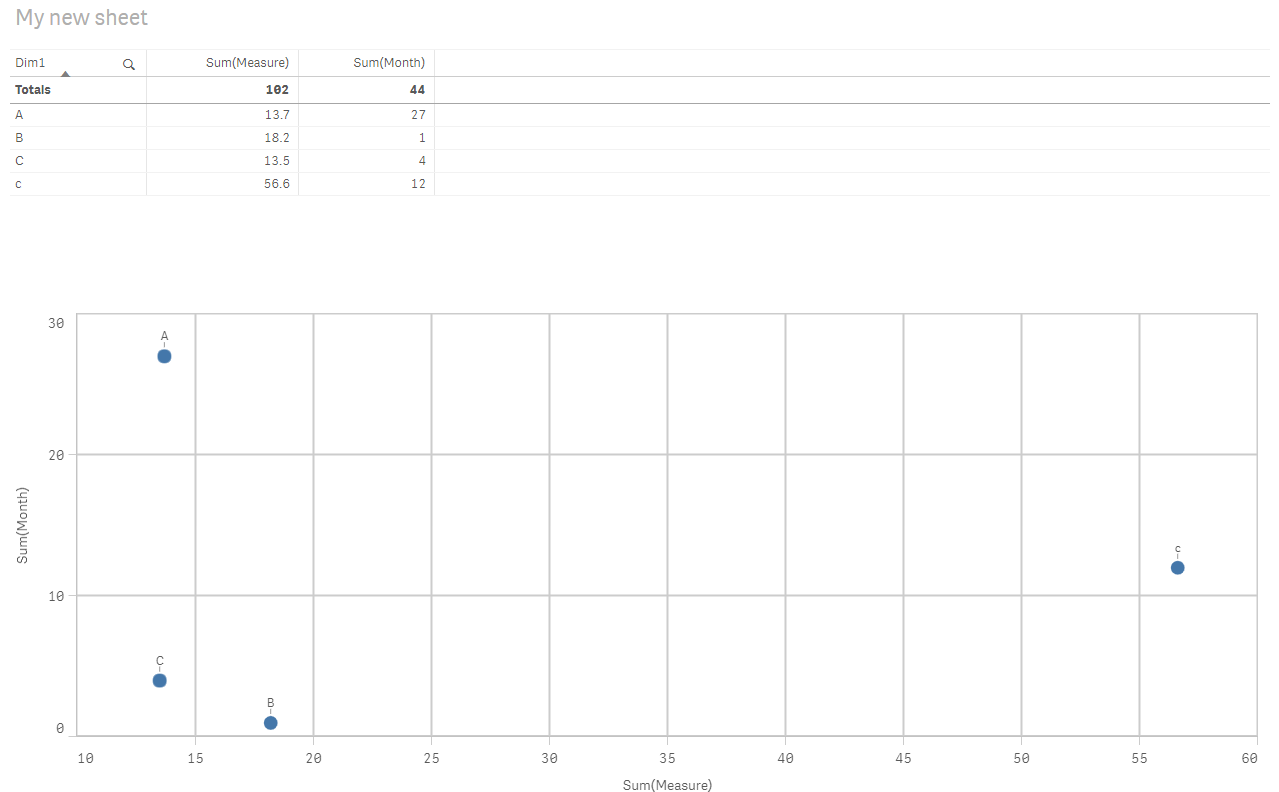
Create a simple table with one dimension and two measures, and confirm those are the values you'd like to plot, than drag a scatter plot over it and select convert..
I say this just because a table may be simpler to troubleshoot.
If possible put that table together and share a screenshot,
I hope it helps,
Cheers,
Luis
- Mark as New
- Bookmark
- Subscribe
- Mute
- Subscribe to RSS Feed
- Permalink
- Report Inappropriate Content
this is my sample table.I don't think it will work not sure how to use it a measure though.
if i use the code as a dimension it shows all the values- but when i use it as a measure i see values only where there is null in the other measure.
| . | code as dimension | . | code as measure(this is my measure 2) |
|---|---|---|---|
| dimension 1 | num(month((date ]))) | measure1 | num(MONTH((#date))) |
| A | 12 | null | 1.2E+1 |
| A | 9 | null | 9.0E+0 |
| A | 4 | null | 4.0E+0 |
| B | 1 | 18.2 | - |
| c | 3 | 14.6 | - |
| c | 1 | 14.2 | - |
| c | 2 | 13.9 | - |
| c | 6 | 13.9 | - |
| A | 2 | 13.7 | - |
| C | 4 | 13.5 | - |
| A | 11 | 12.8 | - |
- Mark as New
- Bookmark
- Subscribe
- Mute
- Subscribe to RSS Feed
- Permalink
- Report Inappropriate Content
Hey Deva- what you asked me is my exact question - how to use the num(month) as a measure?.is it possible if so how?
for the sample data please see my reply to Luis.
- Mark as New
- Bookmark
- Subscribe
- Mute
- Subscribe to RSS Feed
- Permalink
- Report Inappropriate Content
Hi,
I wanted to see the data to show you that it may not be material for a Scatter Plot. For a plot you need a unique dimension and each unique dimension with two numbers so you can plot them. In the data you're showing you only have 4 unique dimensions or 4 unique values so you can expect 4 bubbles.... So you may need to rethink what you really want to show
I hope this helps