Unlock a world of possibilities! Login now and discover the exclusive benefits awaiting you.
- Qlik Community
- :
- Forums
- :
- Analytics
- :
- New to Qlik Analytics
- :
- Re: cumulative sum in bar chart
- Subscribe to RSS Feed
- Mark Topic as New
- Mark Topic as Read
- Float this Topic for Current User
- Bookmark
- Subscribe
- Mute
- Printer Friendly Page
- Mark as New
- Bookmark
- Subscribe
- Mute
- Subscribe to RSS Feed
- Permalink
- Report Inappropriate Content
cumulative sum in bar chart
Hello everyone,
I am trying to calculate cumulative sum in a bar chart in Qlik Sense which has two dimensions; month and year. My measure is sum of Sales.
What I want is, sales values should be cumulatively summed in bar chart for the selected months.
For example: March 2016 sales values should be sum of Jan 2016 and Feb 2016 on pivot table and rest of them also should be the same.
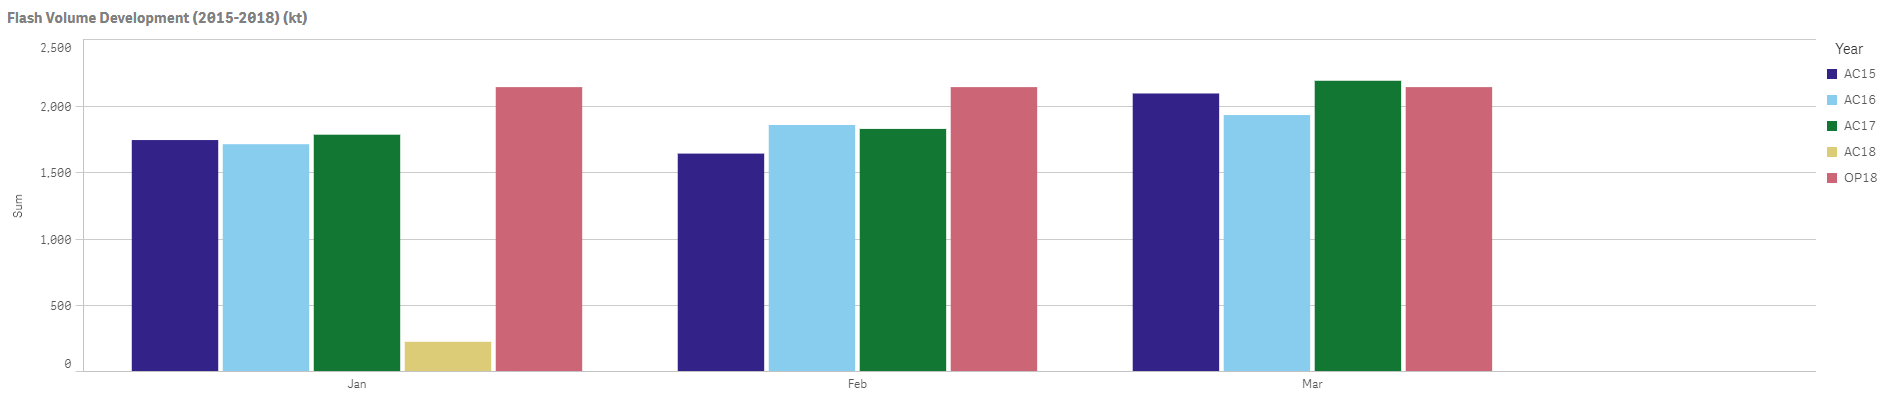
Right now I have below bar chart, it is only showing the related month year sales data.
I have tried "=RangeSum(Above(Sum(Sales), 0, RowNo(total)))" but it has not worked. Result of the "=RangeSum(Above(Sum(Sales), 0, RowNo(total)))" is below picture.
.PNG)
Please suggest me any solution if anyone of you gone through the same problem.
Thanks.
OY
- « Previous Replies
- Next Replies »
- Mark as New
- Bookmark
- Subscribe
- Mute
- Subscribe to RSS Feed
- Permalink
- Report Inappropriate Content
Hello everyone,
I have a similar issue but even after using your solution my problem is still there.
My bar chart uses those 3 components :
- Dates as Group : =Year(Date(Date#(MyField_Date,'DD-MMM-YY'),'YYYY-MM')) & ' - ' & num(Month(Date(Date#(Myfield_Date,'DD-MMM-YY'),'YYYY-MM')),'00')
- Status as Bars : = MyField_Status
- Cumulative Status as Lengh of bar :
RangeSum(Above(
Count (
if (
Not Isnull (Date(Date#(MyField_Date,'DD-MMM-YY'),'MMM-YYYY'))
and
not
(
isnull(MyField_Status)
or
len(trim(MyField_Status))= 0
)
,(Date(Date#(MyField_Date,'DD-MMM-YY'),'MMM-YYYY')),null()
)
)
,0,RowNo()))
What I want is to have the cumulated number of dates associated with a status per Year.The counting is done on the month of the dates and the the cumulus goes back restart from 0 for each year.
- « Previous Replies
- Next Replies »