Unlock a world of possibilities! Login now and discover the exclusive benefits awaiting you.
- Qlik Community
- :
- Forums
- :
- Analytics
- :
- New to Qlik Analytics
- :
- Re: stacked bar in qliksense
- Subscribe to RSS Feed
- Mark Topic as New
- Mark Topic as Read
- Float this Topic for Current User
- Bookmark
- Subscribe
- Mute
- Printer Friendly Page
- Mark as New
- Bookmark
- Subscribe
- Mute
- Subscribe to RSS Feed
- Permalink
- Report Inappropriate Content
stacked bar in qliksense
Hi all,
I would need help on the stacked bar chart in qliksense.
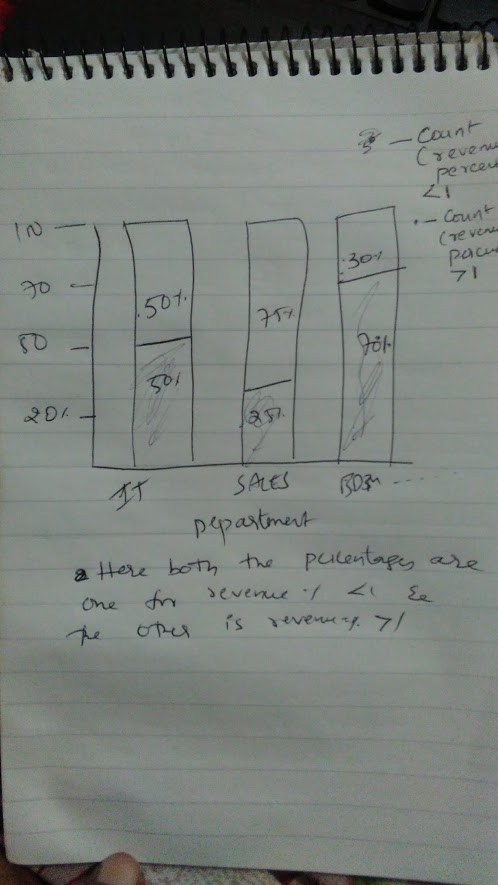
I have 3 columns of data i.e Department, Revenue Original, Revenue Estimated.
Now i have to calculate revenue ratio i.e revenue original / revenue estimated -
who calculate the percentage (revenue original/revenue estimate) / total of both sum and if the ratio is <1 make it revenue failure if not revenue failure.
and we need to count the number of revenue failure and revenue pass percentage.
those percentage graph should be on bar chart .
Ex is attached in the image and source spread sheet is also attached - please help me out
- Mark as New
- Bookmark
- Subscribe
- Mute
- Subscribe to RSS Feed
- Permalink
- Report Inappropriate Content
any help please
- Mark as New
- Bookmark
- Subscribe
- Mute
- Subscribe to RSS Feed
- Permalink
- Report Inappropriate Content
sthing like this?
or sthing like this:
- Mark as New
- Bookmark
- Subscribe
- Mute
- Subscribe to RSS Feed
- Permalink
- Report Inappropriate Content
Second style but inside the bar percentages are needed- can you please share it
- Mark as New
- Bookmark
- Subscribe
- Mute
- Subscribe to RSS Feed
- Permalink
- Report Inappropriate Content
You cannot have the percentage inside of the bars in the native bar chart of qlik.. maybe an extension would allow it (see this one : Qlik Branch )
as for the expressions used:
dim:
Department
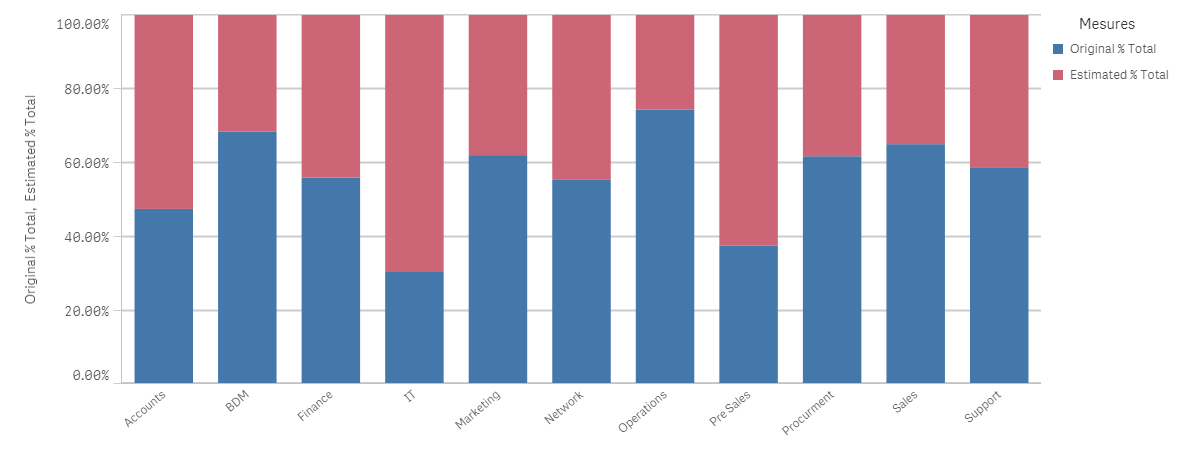
measures:
Sum([Revenue Original]) / (sum({<Department>}[Revenue Estimated])+sum({<Department>}[Revenue Original]))
Sum([Revenue Estimated]) / (sum({<Department>}[Revenue Estimated])+sum({<Department>}[Revenue Original]))
- Mark as New
- Bookmark
- Subscribe
- Mute
- Subscribe to RSS Feed
- Permalink
- Report Inappropriate Content
have u tried using the 2 expressions?
- Mark as New
- Bookmark
- Subscribe
- Mute
- Subscribe to RSS Feed
- Permalink
- Report Inappropriate Content
yes but the logic i need is count of % <1 and count of % >1
i need to have those
- Mark as New
- Bookmark
- Subscribe
- Mute
- Subscribe to RSS Feed
- Permalink
- Report Inappropriate Content
any help please
- Mark as New
- Bookmark
- Subscribe
- Mute
- Subscribe to RSS Feed
- Permalink
- Report Inappropriate Content
suggestions please
- Mark as New
- Bookmark
- Subscribe
- Mute
- Subscribe to RSS Feed
- Permalink
- Report Inappropriate Content
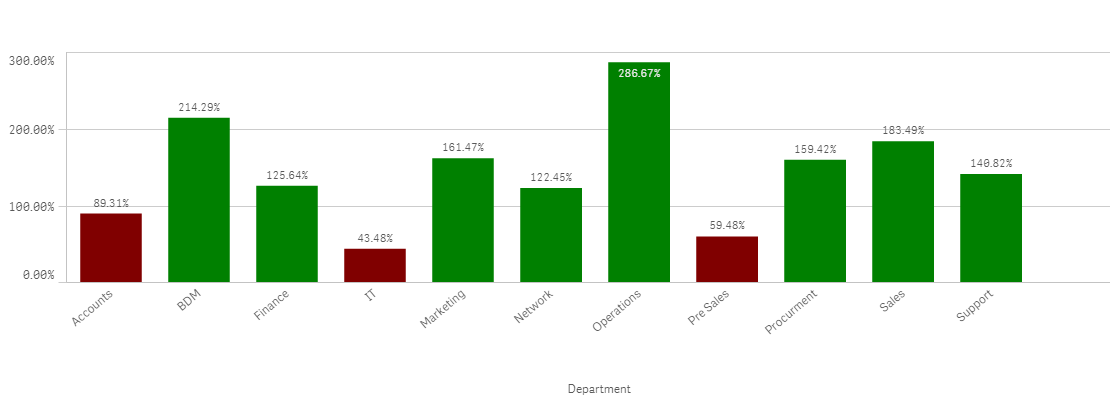
maybe
count({<Department={"=(Sum([Revenue Original]) / sum([Revenue Estimated]))>1"}>}Department)
count({<Department={"=(Sum([Revenue Original]) / sum([Revenue Estimated]))<=1"}>}Department)