Unlock a world of possibilities! Login now and discover the exclusive benefits awaiting you.
- Qlik Community
- :
- Discover
- :
- About
- :
- Water Cooler
- :
- Group data on a bar chart to create an 'Others' ca...
- Subscribe to RSS Feed
- Mark Topic as New
- Mark Topic as Read
- Float this Topic for Current User
- Bookmark
- Subscribe
- Mute
- Printer Friendly Page
- Mark as New
- Bookmark
- Subscribe
- Mute
- Subscribe to RSS Feed
- Permalink
- Report Inappropriate Content
Group data on a bar chart to create an 'Others' category
HI all.
I'm a newbie on the Qlikview World, so I really need your help
I've been looking on the forums and I can't found an exact answer to my problem.
I have a bar chart and a dimension called "Values". When I selected items from "Values", they appears on the chart. My problem is that besides the selected data I need to add a new one called 'Others', that contains the summatory of the non selected data.
I found that expression
if(dimensionality(),sum({<product =e(product)>}sale),sum(sale))
With this, the selected values are not shown on the chart, only the non selected (great, I need this), but I don't know how to combine to obtain the selected data and the 'Others' in the same chart
Thanks a lot
- « Previous Replies
-
- 1
- 2
- Next Replies »
Accepted Solutions
- Mark as New
- Bookmark
- Subscribe
- Mute
- Subscribe to RSS Feed
- Permalink
- Report Inappropriate Content
Sorry for the delayed answer mate - I had my expression slightly wrong. Instead of:
if($(vValueList) = 'Others',
sum({<characteristic_value=E()>} fact_sold_units),
sum(fact_sold_units)
)
you need:
if($(vValueList) = 'Others',
sum({<characteristic_value=E()>} fact_sold_units),
sum(IF(characteristic_value=$(vValueList),fact_sold_units))
)
See attached,hope it helps,
Jason
- Mark as New
- Bookmark
- Subscribe
- Mute
- Subscribe to RSS Feed
- Permalink
- Report Inappropriate Content
- Mark as New
- Bookmark
- Subscribe
- Mute
- Subscribe to RSS Feed
- Permalink
- Report Inappropriate Content
I has seen that thread. I tried to replicate that solution, but I only can selected one value, if I try with more than one, no values are shown :s
On that solution, this formula appears to calculate the dimension
=ValueList('$(=only(Vendor))', 'Others')
I tried modifying to
=ValueList(GetFieldSelections(characteristic_value, ','), 'Others')
but the selected values appears grouped in one line, not in different categories.
Any ideas?
- Mark as New
- Bookmark
- Subscribe
- Mute
- Subscribe to RSS Feed
- Permalink
- Report Inappropriate Content
Try replacing the =Only(Vendor) with =(Concat(Distinct Vendor,','))
- Mark as New
- Bookmark
- Subscribe
- Mute
- Subscribe to RSS Feed
- Permalink
- Report Inappropriate Content
Or use =GetFieldSelections(Vendor,',')
Only replace the =Only(Vendor) bit - the rest should stay the same!
- Mark as New
- Bookmark
- Subscribe
- Mute
- Subscribe to RSS Feed
- Permalink
- Report Inappropriate Content
I tried both options, but the categories appear group in the chart (see attached file)
I need that 'basket', 'outdoor', 'running' and any other selected category appears separately
Thansk in advance
- Mark as New
- Bookmark
- Subscribe
- Mute
- Subscribe to RSS Feed
- Permalink
- Report Inappropriate Content
Can you post your app?
- Mark as New
- Bookmark
- Subscribe
- Mute
- Subscribe to RSS Feed
- Permalink
- Report Inappropriate Content
Here is the file
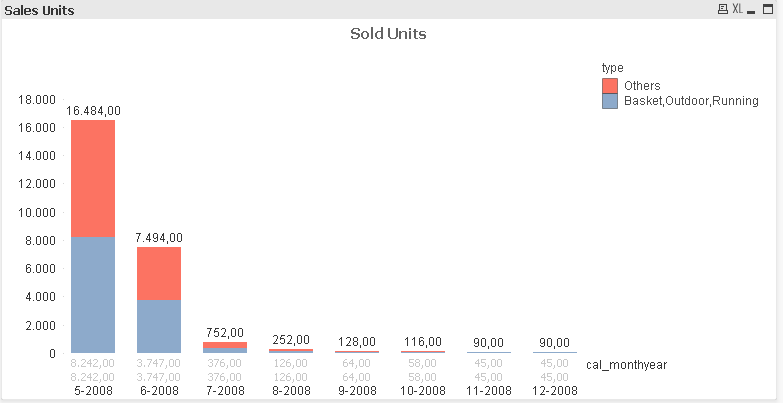
I need to achieve the same that in the "Chart 1", but grouping all not selected "values" on a category call "Others". I try to do that on the "Chart 2".
BTW, I know that the expression on chart 2 needs to be modified, but for know I want to fix the displa y of categories on the chart
I'm using a personal version of qlikview (I don't know if this will be a problem)
Thanks
- Mark as New
- Bookmark
- Subscribe
- Mute
- Subscribe to RSS Feed
- Permalink
- Report Inappropriate Content
I'm using a personal version of qlikview, so I'm not sure if this will be a problem to see my file
- Mark as New
- Bookmark
- Subscribe
- Mute
- Subscribe to RSS Feed
- Permalink
- Report Inappropriate Content
Got it working. ValueList() is very strict about what it receives and Concat() doesn't directly work. Instead I have created a variable vValueList that builds up a ValueList() expression. Then, in your dimension just used $(vValueList) to evaluate the expression. This is a common approach for certain dynamic set anlaysis expressions too. vValueListis:
='ValueList(' & Chr(39) & Concat(DISTINCT characteristic_value,Chr(39)&Chr(44)&Chr(39)) & Chr(39) & ',' & Chr(39) & 'Others' & Chr(39) & ')'
which renders to:
ValueList('Basket','Female','Futbol','Others')
which evaluates to the list. Updated app attached.
Cheers,
Jason
- « Previous Replies
-
- 1
- 2
- Next Replies »