Unlock a world of possibilities! Login now and discover the exclusive benefits awaiting you.
- Qlik Community
- :
- Forums
- :
- Analytics
- :
- New to Qlik Analytics
- :
- Re: 1st 4 weeks of sales across multiple sku's
- Subscribe to RSS Feed
- Mark Topic as New
- Mark Topic as Read
- Float this Topic for Current User
- Bookmark
- Subscribe
- Mute
- Printer Friendly Page
- Mark as New
- Bookmark
- Subscribe
- Mute
- Subscribe to RSS Feed
- Permalink
- Report Inappropriate Content
1st 4 weeks of sales across multiple sku's
Hi,
I have a set of Sku's with sales data by week and I need to show the 1st 4 weeks of sales
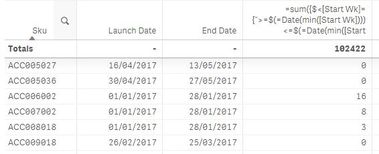
The following set analysis works but only gives the correct answer if 1 single sku is selected, when more then 1 sku is selected the sum from the min date of all the sku's is shown rather then the individual lines
=sum({$<[Start Wk]={">=$(=Date(min([Start Wk]))) <=$(=Date(min([Start Wk])+27))"}>} [Sold Qty])
e.g.
if the minimum date in the whole table is 1/1/2017 then it will sum 4 weeks from that date regardless of the actual 1st sale date for the sku
How can I make get the correct sum when multiple lines are shown in the table?
Accepted Solutions
- Mark as New
- Bookmark
- Subscribe
- Mute
- Subscribe to RSS Feed
- Permalink
- Report Inappropriate Content
Try this
=Sum(Aggr(
  If([Start Wk] >= Min(TOTAL <Sku> [Start Wk]) and
     [Start Wk] <= Min(TOTAL <Sku> [Start Wk]) + 27,
  [Sold Qty])
, [Start Wk], Sku))
- Mark as New
- Bookmark
- Subscribe
- Mute
- Subscribe to RSS Feed
- Permalink
- Report Inappropriate Content
Didn't work initially but seems to with a Sum(Sold Qty) rather then just [Sold Qty]
=Sum(Aggr(
  If([Start Wk] >= Min(TOTAL <Sku> [Start Wk]) and
     [Start Wk] <= Min(TOTAL <Sku> [Start Wk]) + 27,
  Sum([Sold Qty]))
, [Start Wk], Sku))
Thanks vm for the help Sunny
- Mark as New
- Bookmark
- Subscribe
- Mute
- Subscribe to RSS Feed
- Permalink
- Report Inappropriate Content
Hi Sunny,
Wondering if you can help me further on this, hope so
I am now setting up a pivot, I have a number of Host stores so need the set analysis to also take the [Host] field into account.
I would like the pivot to show the 1st 4 weeks for each host, currently the calculation uses the same date range for each I'd like it to treat each host individually as one host may have it's 1st sale on 2/2/2018 and another start it's 4 weeks from 7/7/2018
I've tried a few variations but can't seem to find the syntax to expand what you gave me earlier
- Mark as New
- Bookmark
- Subscribe
- Mute
- Subscribe to RSS Feed
- Permalink
- Report Inappropriate Content
I don't think I am able to completely follow your request. Would you be able to elaborate with an example may be?
- Mark as New
- Bookmark
- Subscribe
- Mute
- Subscribe to RSS Feed
- Permalink
- Report Inappropriate Content
I think I've got it
Was having trouble with the syntax on the Min but this seems to work
=Sum(Aggr(
If([Start Wk] >= Min(TOTAL <Host, SKU> [Start Wk]) and
[Start Wk] <= Min(TOTAL <Host, SKU> [Start Wk]) + 27,
sum([Sold Qty]))
, Host, [Start Wk], SKU))
I'm using this to create a pivot table that shows the initial impact of products during the 1st 4 weeks of launch across different hosts so we can see best reactions and then further analyse on reasons why .
As they hit host stores (e.g. Debenhams, John Lewis etc..) on completely different dates I needed the formula to aggregate by Host as well as date and sku
- Mark as New
- Bookmark
- Subscribe
- Mute
- Subscribe to RSS Feed
- Permalink
- Report Inappropriate Content

