Unlock a world of possibilities! Login now and discover the exclusive benefits awaiting you.
- Qlik Community
- :
- Forums
- :
- Analytics
- :
- New to Qlik Analytics
- :
- 4 weeks data
- Subscribe to RSS Feed
- Mark Topic as New
- Mark Topic as Read
- Float this Topic for Current User
- Bookmark
- Subscribe
- Mute
- Printer Friendly Page
- Mark as New
- Bookmark
- Subscribe
- Mute
- Subscribe to RSS Feed
- Permalink
- Report Inappropriate Content
4 weeks data
- « Previous Replies
-
- 1
- 2
- Next Replies »
- Mark as New
- Bookmark
- Subscribe
- Mute
- Subscribe to RSS Feed
- Permalink
- Report Inappropriate Content
Hi Gysbert Wassenaar,
If i give like this it will produce 1;
count({$<week_number={$(vMaxWeek)}>}invitation_id)/count(TOTAL{$<week_number={$(vMaxWeek)}>}invitation_id).
here i am taking vMaxWeek has variable.
AND
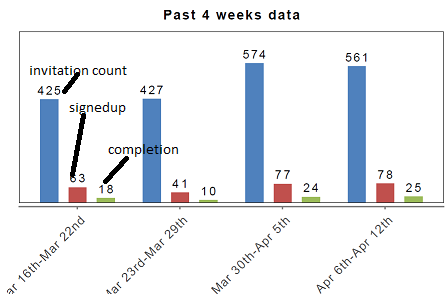
I need a line graph like below and here we have to give some start date and end date for that it should produce line graph and the data point should take randomly or three months once. see the image below.

Please help this.
Thanks,
Pramod
- Mark as New
- Bookmark
- Subscribe
- Mute
- Subscribe to RSS Feed
- Permalink
- Report Inappropriate Content
If i give like this it will produce 1;
Perhaps you need to change the number format setting so that it will show percentages instead of whole numbers.
talk is cheap, supply exceeds demand
- Mark as New
- Bookmark
- Subscribe
- Mute
- Subscribe to RSS Feed
- Permalink
- Report Inappropriate Content
Hi Gysbert Wassenaar,
Great thanks, today you helped me lot. i found answers for many issues.
If you don't mind will you explain why we have used below lines, it's functionality.
date#(left(date_created,10),'YYYY-MM-DD') as date_created,
time#(mid(date_created,12,8),'hh:mm:ss') as time_created,
Thanks,
Pramod
- Mark as New
- Bookmark
- Subscribe
- Mute
- Subscribe to RSS Feed
- Permalink
- Report Inappropriate Content
The date_created values in your csv file couldn't be interpreted as timestamp values directly because the contained extra characters like T and Z. That's why I used left and mid to extract the parts with the date and the time from the text string.
talk is cheap, supply exceeds demand
- Mark as New
- Bookmark
- Subscribe
- Mute
- Subscribe to RSS Feed
- Permalink
- Report Inappropriate Content
ok what about that line graph? Gysbert Wassennar
Thanks,
Pramod
- Mark as New
- Bookmark
- Subscribe
- Mute
- Subscribe to RSS Feed
- Permalink
- Report Inappropriate Content
Start a new discussion please.
talk is cheap, supply exceeds demand
- « Previous Replies
-
- 1
- 2
- Next Replies »
