Unlock a world of possibilities! Login now and discover the exclusive benefits awaiting you.
- Qlik Community
- :
- Forums
- :
- Analytics
- :
- New to Qlik Analytics
- :
- Accumulated SUM for remaining months
- Subscribe to RSS Feed
- Mark Topic as New
- Mark Topic as Read
- Float this Topic for Current User
- Bookmark
- Subscribe
- Mute
- Printer Friendly Page
- Mark as New
- Bookmark
- Subscribe
- Mute
- Subscribe to RSS Feed
- Permalink
- Report Inappropriate Content
Accumulated SUM for remaining months
Hi guys!
Long time lurker and beginner using Qlik. You guys helped me countless times so far.
I have come across a requirement change to one of my panels, in which a chart shows several cumulative measures, all of them being rangesums according to specific date parameters.
Below is a picture of my current chart:
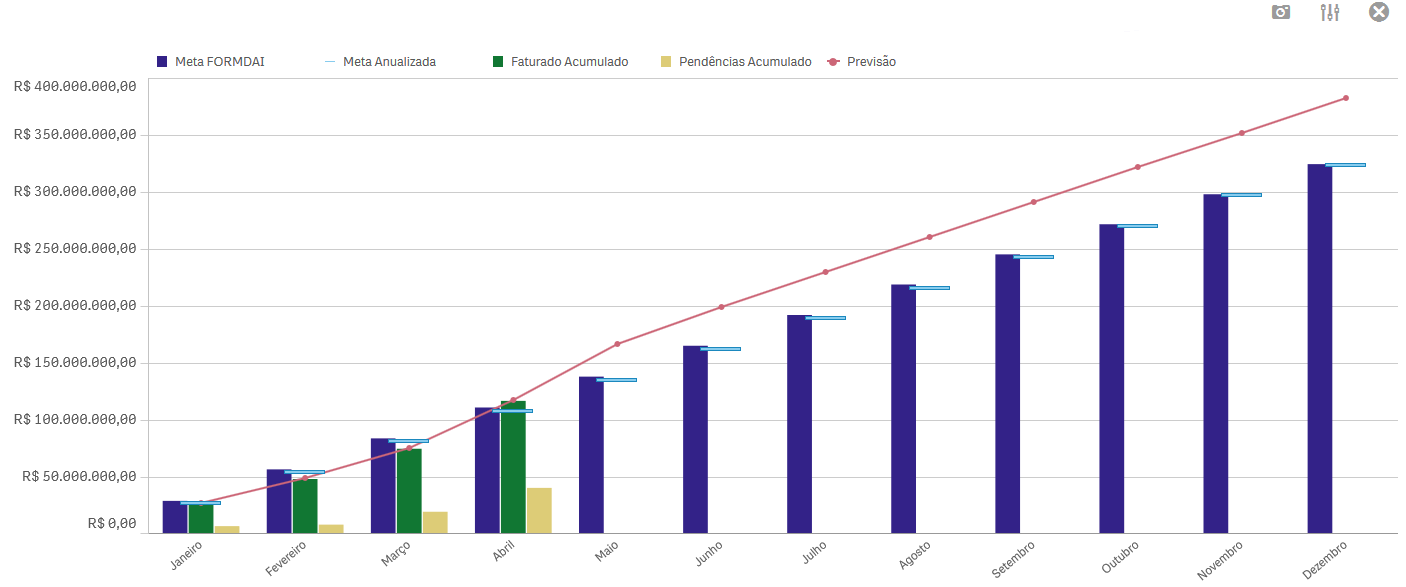
A little explanation:
The "Previsão" measure is an alternate measure which shows values according to the code below:
IF([Mês_comp] <= Mês,
Money(rangesum(above(sum(Valor),0, rowno()))),
Money(rangesum(above(sum(Valor_Previsao),0, rowno())))
)
What I need to change, but can´t and it is driving me insane:
Instead of doing Money(rangesum(above(sum(Valor_Previsao),0, rowno()))) as an alternative calculation, it needs to sum the "Faturado Acumulado" measure (the Green bar) plus the remaining values of the "Previsão" measure. No matter what I do, it still calculates "Previsão" for the full year (and not just from "Maio" onwards).
I have the data in two separate tables. They are linked by a field named "Customer" and another one named "Mês" (which is "month" in english).
Can you guys help?
Accepted Solutions
- Mark as New
- Bookmark
- Subscribe
- Mute
- Subscribe to RSS Feed
- Permalink
- Report Inappropriate Content
After 3 days, we could solve the calculation.
What we have done was create a new inline table that had the months names (ex: January, February...) in a collumn and on a different collumn, its numeric counterpart (1, 2...). With that, we could subtract it from the rowno() value, and it made de rangesum start at the right point in time. Below is the code used with generic fields names:
Money(
IF(max("rowno() value for months that had revenue")=0, 0,
IF(max("rowno() value for months that had revenue")>0,
IF(not(isnull(["revenue value"])),rangesum(above(sum(["revenue value"]),0, rowno())),rangesum(above(sum(["revenue value"]),0, rowno())) + rangesum(above(sum("revenue forecast"),0,"Month Numeric ID"- max("rowno() value for months that had revenue")))
)
)
)
)