Unlock a world of possibilities! Login now and discover the exclusive benefits awaiting you.
- Qlik Community
- :
- Forums
- :
- Analytics
- :
- New to Qlik Analytics
- :
- Re: Action Button & Invalid visualisation
- Subscribe to RSS Feed
- Mark Topic as New
- Mark Topic as Read
- Float this Topic for Current User
- Bookmark
- Subscribe
- Mute
- Printer Friendly Page
- Mark as New
- Bookmark
- Subscribe
- Mute
- Subscribe to RSS Feed
- Permalink
- Report Inappropriate Content
Action Button & Invalid visualisation
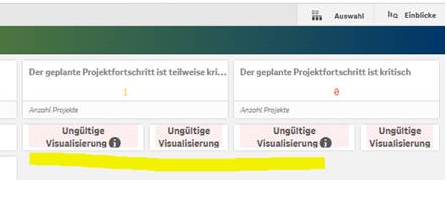
Hi, I'm using Qlik Sense version February 2021. In my apps I'm using Action Button - from Qlik standard charts.
One instance that uses the app is on an old version (November 2019 Patch 13) and where there is normally a Chart "Button" an error pops up: "Invalid visualisation". What could I replace the Button with, but have it have the same effect? Currently the user when clicking on the Button is shown projects that meet certain criteria. I wouldn't want to use a filter, because the end user doesn't quite know what to select from the filter to get the right result - so I used a Button.
Thank you.
- Mark as New
- Bookmark
- Subscribe
- Mute
- Subscribe to RSS Feed
- Permalink
- Report Inappropriate Content
Hi
Maybe load an inline in the script with the values you have specified in the button and add a grouping field, like
Load * inline
[Project, ButtonFilter
Project 1, Project Meet Criteria
Project 2, Project Meet Criteria
Project 3, Project Meet Criteria];
Use ButtonFilter as filter, should give you the same result as a button.
- Mark as New
- Bookmark
- Subscribe
- Mute
- Subscribe to RSS Feed
- Permalink
- Report Inappropriate Content
I am a beginner. Could you tell me more details? What chart to add, where to add the code ? Thank you very much in advance!
- Mark as New
- Bookmark
- Subscribe
- Mute
- Subscribe to RSS Feed
- Permalink
- Report Inappropriate Content
First I should say, the best solution would of course be to upgrade to a later version of Qlik. This solution will only imitate the behavior of a Button, but will not be as good as a Button can be.
The solution requires you to work in the script, are you familiar with that? The code can be anywhere in you script. When I have inline loads in my scripts I like to have them in a separate section.
data:
Load * inline
[Project, Amount
P001,10000
P002,20000
P003,30000
P004,40000
P005,50000
P006,60000
P007,70000
P008,80000
P009,90000
P010,100000];
If the above is a sample representing your actual data you can add something like this, where you specify your project criterias.
load * inline [
Project, ButtonFilter
P001, Project Meet Criteria A
P005, Project Meet Criteria A
P010, Project Meet Criteria A
P005, Project Meet Criteria B
P009, Project Meet Criteria B];
Now you can use your Filter ButtonFilter as a regular filter


To get it a little more "Button like" you can load criterias in separate loads like this
load * inline [
Project, ButtonFilter1
P001, Project Meet Criteria A
P005, Project Meet Criteria A
P010, Project Meet Criteria A];
Concatenate
load * inline [
Project, ButtonFilter2
P005, Project Meet Criteria B
P009, Project Meet Criteria B];
And add two filters to get something like this:

- Mark as New
- Bookmark
- Subscribe
- Mute
- Subscribe to RSS Feed
- Permalink
- Report Inappropriate Content
Hi,
You can re-create that Button by using custom object.
On QS Nov 2019, that Button object is : "Navigation button control" in Custom objects > Dashboard Bundle
From June 2020 release, Qlik brings them to built-in object as Button.
- Mark as New
- Bookmark
- Subscribe
- Mute
- Subscribe to RSS Feed
- Permalink
- Report Inappropriate Content
Hopefully this thread isn't old enough to be considered necro-posting - but in the interest of back-compatibility - is there a way to do an in-place swap of components?
I have been looking at all the previously published Qlik World Viz-Tips Example dashboards, and they all rely on a component ( action-button ) that appears to have been removed completely, but given the way qlik handles the missing element, there's no way to tell what data it was using etc.
Example.

Maybe at some point, Qlik will update them?