Unlock a world of possibilities! Login now and discover the exclusive benefits awaiting you.
- Qlik Community
- :
- Forums
- :
- Analytics
- :
- New to Qlik Analytics
- :
- Add 2 dimensions and 2 measures in bar chart - qli...
- Subscribe to RSS Feed
- Mark Topic as New
- Mark Topic as Read
- Float this Topic for Current User
- Bookmark
- Subscribe
- Mute
- Printer Friendly Page
- Mark as New
- Bookmark
- Subscribe
- Mute
- Subscribe to RSS Feed
- Permalink
- Report Inappropriate Content
Add 2 dimensions and 2 measures in bar chart - qlik sense
Hello People
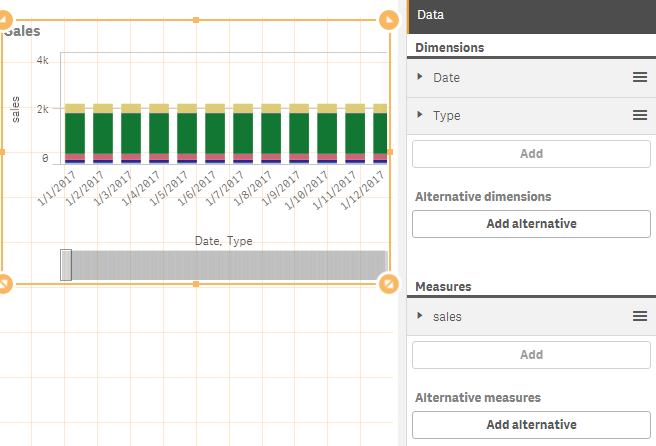
I need to show day wise sales along with daily targets for each product type in the same chart.
Basically i need to add 2 dimension and 2 measures in the bar chart but it is not possible in qlik sense.
Please provide me alternate solutions ,
* Any other better chart to compare sales vs target on daily basis of products.
* can i add reference line for target (each product has different target per day)
* or provide me any other efficient solution for the issue.
- Mark as New
- Bookmark
- Subscribe
- Mute
- Subscribe to RSS Feed
- Permalink
- Report Inappropriate Content
An alternative would be use a combo chart. In that way you will have two fields that way you have y axis on the left and a different field for the y axis on the right.
There is an anychart extension that should allow you to do what you're looking for as well:
https://developer.qlik.com/garden/58cf59cd61d353a813f4a37e
This thread has more info on both approaches:
- Mark as New
- Bookmark
- Subscribe
- Mute
- Subscribe to RSS Feed
- Permalink
- Report Inappropriate Content
Hi,
Link is not working
can you please share working link....
Thanks