Unlock a world of possibilities! Login now and discover the exclusive benefits awaiting you.
- Qlik Community
- :
- Forums
- :
- Analytics
- :
- New to Qlik Analytics
- :
- Re: Adding KPI according to selection
- Subscribe to RSS Feed
- Mark Topic as New
- Mark Topic as Read
- Float this Topic for Current User
- Bookmark
- Subscribe
- Mute
- Printer Friendly Page
- Mark as New
- Bookmark
- Subscribe
- Mute
- Subscribe to RSS Feed
- Permalink
- Report Inappropriate Content
Adding KPI according to selection
Hi Community:
Wanted to ask if this is possible in Qlik Sense.
I have a data for Auto Dealer that have hierarchy as this:
1. National - All Dealers across the world
2. Dealers Zone
3.Dealer District
4.Dealer Code
I need to create KPI's that summarizing overall satisfaction score for all dealerships grouping it by existing hierarchy.
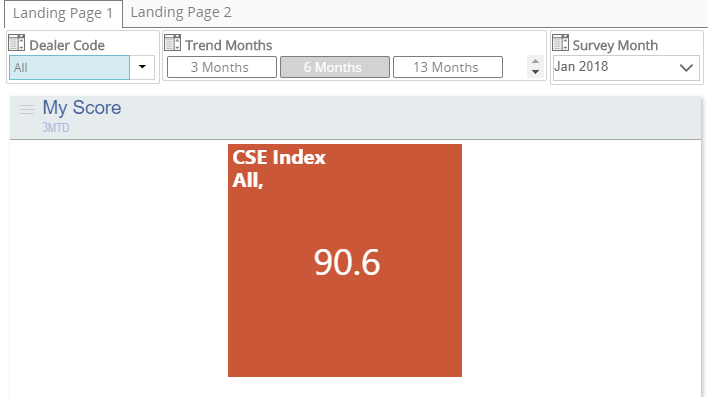
For example First KPI will show National Score (nothing selected yet).
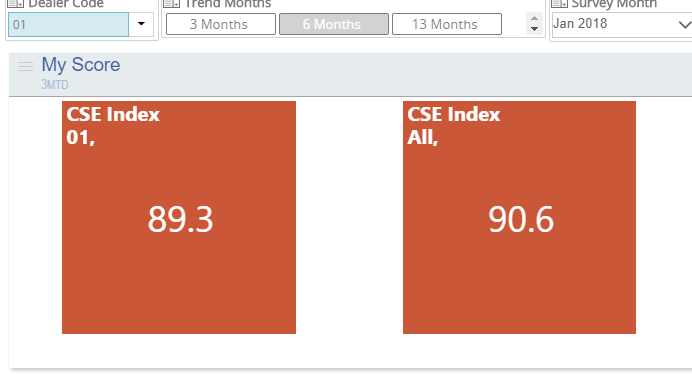
Then when user selects Dealer Zone the App will show two KPI's - One for National and one for Dealer Zone.
And so on
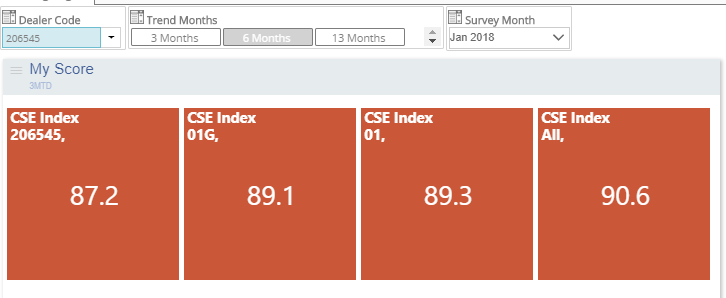
Also when user selects Dealer code - the last dimension in hierarchy the app will show 4 KPI's.
Please see the examples below:
No Selection
Zone Selected:
Code Selected:
Please let me know if it is possible and if yes how to do it.
Thanks
- Mark as New
- Bookmark
- Subscribe
- Mute
- Subscribe to RSS Feed
- Permalink
- Report Inappropriate Content
The existing kpi object won't do that but why don't you use a tree map with a drill down dimension to create a similar effect.
- Mark as New
- Bookmark
- Subscribe
- Mute
- Subscribe to RSS Feed
- Permalink
- Report Inappropriate Content
Hi Andy,
Thank you for replay.
The problem with tree map is that they want to see the comparison.
For example when they select Dealer zone they want to see KPI for this zone compare to KPI to all zones.
When using drill down measure the upper dimension would desappear.
So as I understand there is no way to create such thing other than create four KPI's?
Thanks
- Mark as New
- Bookmark
- Subscribe
- Mute
- Subscribe to RSS Feed
- Permalink
- Report Inappropriate Content
How about using the tab extension with tree maps for each level.
Qlik Branch I know its a fudge but bar writing your own extension you will need to come up with an alternative layout.
perhaps you could do something with a variable to make the tree map display the top level kpi in the tite or subtile of the chart.
I have one dynamically changing chart content here for a number of chart types.
Makes Sense to go round in circles
perhaps it might work with your tree map
- Mark as New
- Bookmark
- Subscribe
- Mute
- Subscribe to RSS Feed
- Permalink
- Report Inappropriate Content
Thanks Andy,
I was thinking about tabs extension but I cannot add more that one chart into one tab.
So what I think I will create 4 KPI's but use getcurentselection function to show the KPI's.
Thank you for your help anyway.
- Mark as New
- Bookmark
- Subscribe
- Mute
- Subscribe to RSS Feed
- Permalink
- Report Inappropriate Content
No problem glad I could help.
Regards
Andy