Unlock a world of possibilities! Login now and discover the exclusive benefits awaiting you.
- Qlik Community
- :
- Forums
- :
- Analytics
- :
- New to Qlik Analytics
- :
- Re: Adding Values based on Condition
- Subscribe to RSS Feed
- Mark Topic as New
- Mark Topic as Read
- Float this Topic for Current User
- Bookmark
- Subscribe
- Mute
- Printer Friendly Page
- Mark as New
- Bookmark
- Subscribe
- Mute
- Subscribe to RSS Feed
- Permalink
- Report Inappropriate Content
Adding Values based on Condition
HI All,
Need a quick help. In the attached excel I need to make Column D in qliksense.
Logic is if the city is Delhi then add customer count of Mix Customers, Non Sales Customers and sale customers which falls under Delhi city.
Same logic is for other city.
Kindly help.
Regards,
Avinash
- Mark as New
- Bookmark
- Subscribe
- Mute
- Subscribe to RSS Feed
- Permalink
- Report Inappropriate Content
Hi,
so you want 3 different measures, separated counts for each country ?
- Mark as New
- Bookmark
- Subscribe
- Mute
- Subscribe to RSS Feed
- Permalink
- Report Inappropriate Content
Correct
- Mark as New
- Bookmark
- Subscribe
- Mute
- Subscribe to RSS Feed
- Permalink
- Report Inappropriate Content
The formatting also should be same as shown in excel.
- Mark as New
- Bookmark
- Subscribe
- Mute
- Subscribe to RSS Feed
- Permalink
- Report Inappropriate Content
Maybe like this ?
test:
LOAD storelocation,
customer_category,
customer_count,
if(storelocation='Delhi',customer_count) as count_Delhi,
if(storelocation='Mumbai',customer_count) as count_Mumbai,
if(storelocation='Chennai',customer_count) as count_Chennai
...
find attached the QVW
- Mark as New
- Bookmark
- Subscribe
- Mute
- Subscribe to RSS Feed
- Permalink
- Report Inappropriate Content
You want to show in a table or to be created within the script?
If you want to show it in a table, you just add an expression as follow:
sum(total <storelocation>customer_count)
- Mark as New
- Bookmark
- Subscribe
- Mute
- Subscribe to RSS Feed
- Permalink
- Report Inappropriate Content
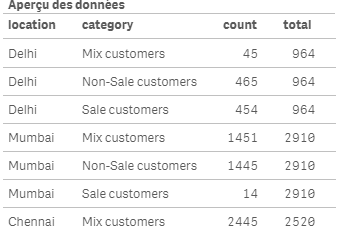
if you want to calculate it within the script:
location:
load * Inline [
location, category, count
Delhi, "Mix customers", 45
Delhi, "Non-Sale customers", 465
Delhi, "Sale customers", 454
Mumbai, "Mix customers", 1451
Mumbai, "Non-Sale customers", 1445
Mumbai, "Sale customers", 14
Chennai, "Mix customers", 2445
Chennai ,"Non-Sale customers", 21
Chennai ,"Sale customers", 54
];
left join (location)
load location, sum(count) as total Resident location Group by location;
result:
- Mark as New
- Bookmark
- Subscribe
- Mute
- Subscribe to RSS Feed
- Permalink
- Report Inappropriate Content
Just load the columns storelocation, customer_category, customer_count and create a Table with the expresion sum(customer_count) with the dimension Storelocation.
OEM Solution Architect
LATAM
- Mark as New
- Bookmark
- Subscribe
- Mute
- Subscribe to RSS Feed
- Permalink
- Report Inappropriate Content
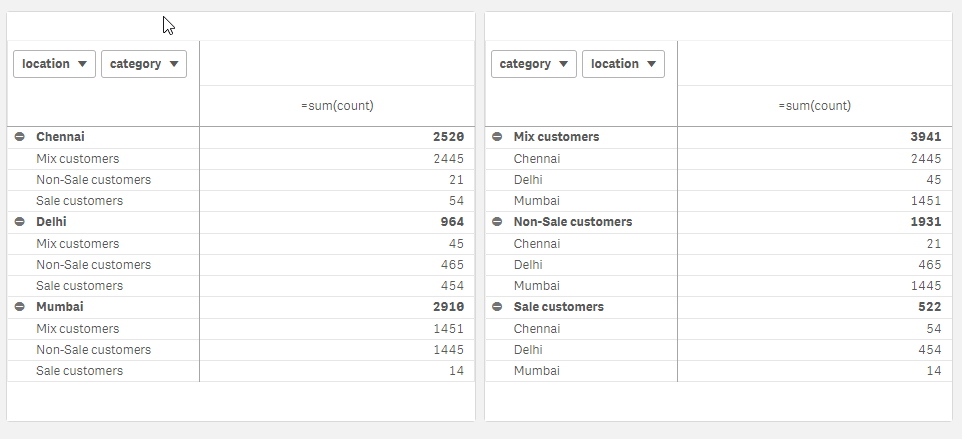
import first 3 columns and create pivot table, then aggregations on location and categories are easily possible;