Unlock a world of possibilities! Login now and discover the exclusive benefits awaiting you.
- Qlik Community
- :
- Forums
- :
- Analytics
- :
- New to Qlik Analytics
- :
- Additional bar shows in bar chart
Options
- Subscribe to RSS Feed
- Mark Topic as New
- Mark Topic as Read
- Float this Topic for Current User
- Bookmark
- Subscribe
- Mute
- Printer Friendly Page
Turn on suggestions
Auto-suggest helps you quickly narrow down your search results by suggesting possible matches as you type.
Showing results for
Not applicable
2016-09-26
05:36 AM
- Mark as New
- Bookmark
- Subscribe
- Mute
- Subscribe to RSS Feed
- Permalink
- Report Inappropriate Content
Additional bar shows in bar chart
Hi all,
I am new to qlikview but I encounter a problem in creating a bar chart. I want to display the sales of last 24 months in a bar chart by using
=left(aggr(MaxString({<[SalesDate] = {'>=$(v24Months)' }>}[anotherDateColumn]), Year, Month),4)&right(aggr(MaxString({<[SalesDate] = {'>=$(v24Months)' }>}[anotherDateColumn]), Year, Month),2)
to create a dimension for displaying the sales of last 24 months
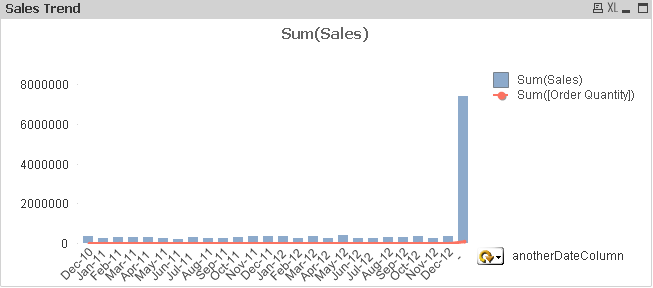
However, there is additional bar displaying in the last.
i am unable to understand this through help also. Thank you
272 Views
1 Solution
Accepted Solutions
MVP
2016-09-26
12:53 PM
- Mark as New
- Bookmark
- Subscribe
- Mute
- Subscribe to RSS Feed
- Permalink
- Report Inappropriate Content
2 Replies
MVP
2016-09-26
12:53 PM
- Mark as New
- Bookmark
- Subscribe
- Mute
- Subscribe to RSS Feed
- Permalink
- Report Inappropriate Content
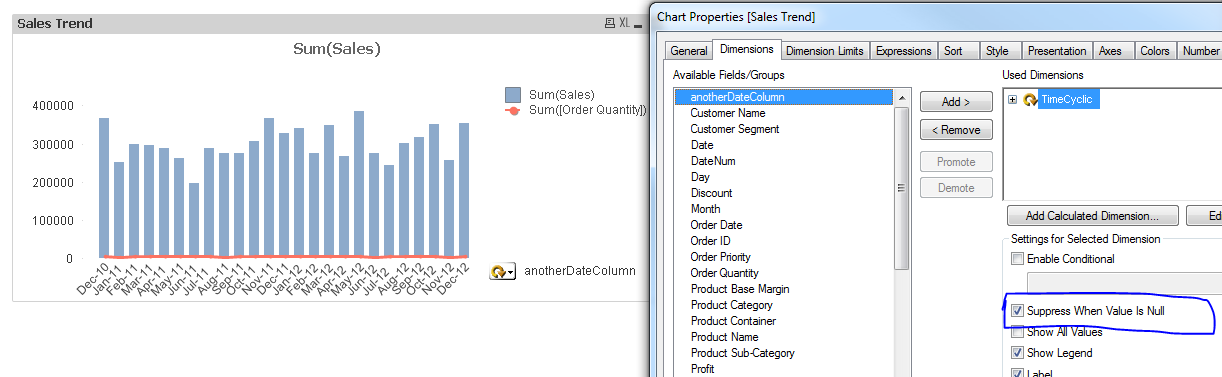
Try checking 'Suppress When Value Is Null' on the dimensions tab
Not applicable
2016-09-28
08:18 AM
Author
- Mark as New
- Bookmark
- Subscribe
- Mute
- Subscribe to RSS Feed
- Permalink
- Report Inappropriate Content
It is work! Thank you.
214 Views
Community Browser