Unlock a world of possibilities! Login now and discover the exclusive benefits awaiting you.
- Qlik Community
- :
- Forums
- :
- Analytics
- :
- New to Qlik Analytics
- :
- Re: Aggr() and pivot table
- Subscribe to RSS Feed
- Mark Topic as New
- Mark Topic as Read
- Float this Topic for Current User
- Bookmark
- Subscribe
- Mute
- Printer Friendly Page
- Mark as New
- Bookmark
- Subscribe
- Mute
- Subscribe to RSS Feed
- Permalink
- Report Inappropriate Content
Aggr() and pivot table
Hi community,
I'm struggling with a pivot table with relative frequencies, and I'm stuck.
My goals is to achieve a simple pivot table that has:
rows: workers
columns: type of sales
measure: percentage of sales for each type of sales.
Here the data:
mov:
Load*Inline
[workerid,sale,type,year
1,5,a,2016
1,20,a,2016
2,1,a,2016
2,8,a,2017
3,9,a,2016
3,2,a,2017
3,1,a,2017
4,4,b,2017
1,5,b,2016
1,5,b,2016
2,3,b,2016
2,5,b,2017
3,9,b,2016
3,3,b,2017
3,9,b,2017
4,1,b,2017
];
Here the result without the percentage but with the simple sum of sales.
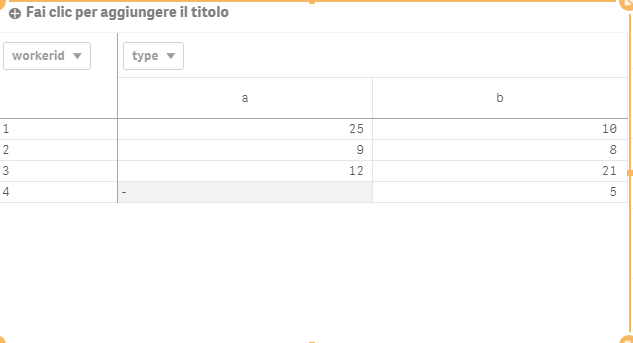
So I decided to have the percentage:
the result should be this: the sum of type a is 46 =25+9+12, and for the type b is 44=10+8+21+5.
Then:
workerid type
a b
1 25/46 10/44
2 9/46 8/44
3 12/46 21/44
4 - 5/44
So I've thought to use the aggr() function in this way:
Sum(sale)/aggr(sum({$<workerid=>} sale),type)
The results are correct, but only if you click one of the workerid, if you do not click one, the result misses some data:
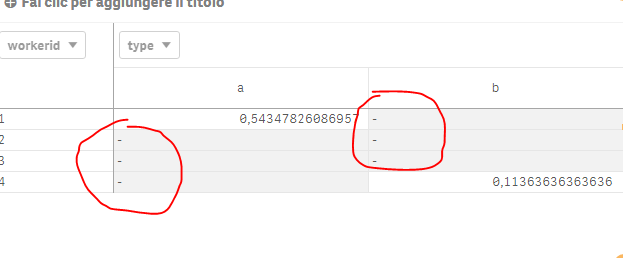
How could I manage to have all the rows filled?
Thanks in advance, attached the app.
- Tags:
- aggr()
- pivot table
Accepted Solutions
- Mark as New
- Bookmark
- Subscribe
- Mute
- Subscribe to RSS Feed
- Permalink
- Report Inappropriate Content
- Mark as New
- Bookmark
- Subscribe
- Mute
- Subscribe to RSS Feed
- Permalink
- Report Inappropriate Content
Try this
Sum(sale)/Sum(TOTAL <type> {$<workerid=>} sale)
- Mark as New
- Bookmark
- Subscribe
- Mute
- Subscribe to RSS Feed
- Permalink
- Report Inappropriate Content
Or this
Sum(sale)/aggr(NODISTINCT sum({$<workerid=>} sale),type)
- Mark as New
- Bookmark
- Subscribe
- Mute
- Subscribe to RSS Feed
- Permalink
- Report Inappropriate Content
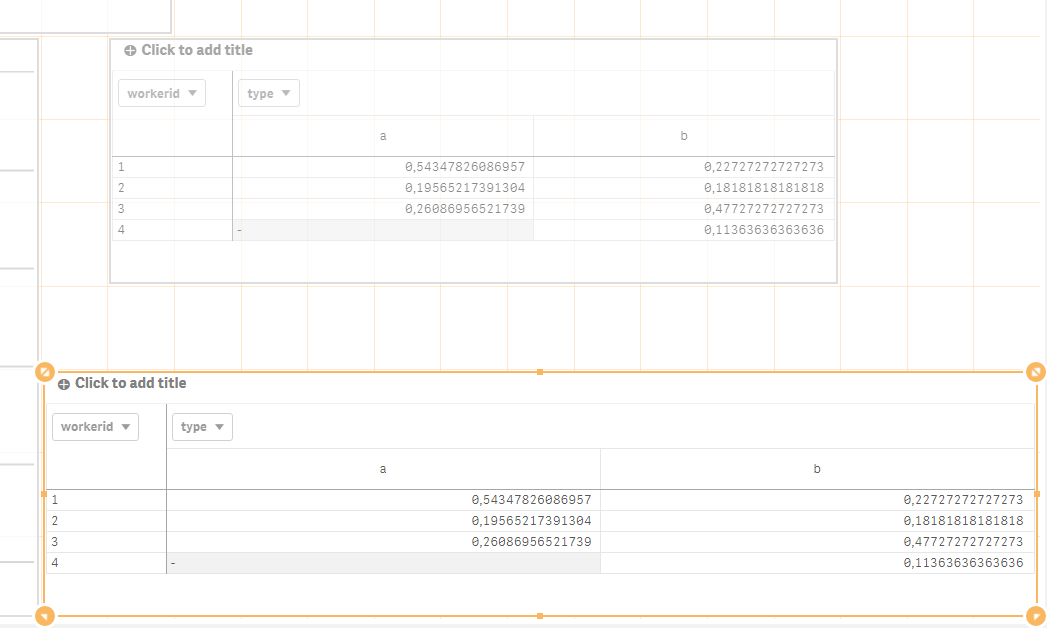
Sample attached with both options... but I would suggest to use TOTAL qualifier as Aggr() have slower performance
- Mark as New
- Bookmark
- Subscribe
- Mute
- Subscribe to RSS Feed
- Permalink
- Report Inappropriate Content
why not use this as a measure
Sum(sale)/sum(total<type> sale)
- Mark as New
- Bookmark
- Subscribe
- Mute
- Subscribe to RSS Feed
- Permalink
- Report Inappropriate Content
As always, Sunny has the answer! Thanks you very much.
I've selected the second because it works well also in other apps than this one that I gave, but also the first answer fits well.