Unlock a world of possibilities! Login now and discover the exclusive benefits awaiting you.
- Qlik Community
- :
- Forums
- :
- Analytics
- :
- New to Qlik Analytics
- :
- Re: Aggr() result for each segment in the aggregat...
- Subscribe to RSS Feed
- Mark Topic as New
- Mark Topic as Read
- Float this Topic for Current User
- Bookmark
- Subscribe
- Mute
- Printer Friendly Page
- Mark as New
- Bookmark
- Subscribe
- Mute
- Subscribe to RSS Feed
- Permalink
- Report Inappropriate Content
Aggr() result for each segment in the aggregation
Hi! I'm new using Qlik Sense Desktop.
I have a problem with an expression for a calculation with this data:
| Customer_Id | Visit_Id | Product_Id | Category_Id | InStock |
|---|---|---|---|---|
| CU1 | 1 | P1 | C1 | 1 |
| CU1 | 1 | P2 | C1 | 0 |
| CU1 | 1 | P3 | C2 | 1 |
| CU1 | 1 | P4 | C2 | 1 |
| CU1 | 2 | P1 | C1 | 1 |
| CU1 | 2 | P2 | C1 | 0 |
| CU1 | 2 | P3 | C2 | 0 |
| CU1 | 2 | P4 | C2 | 1 |
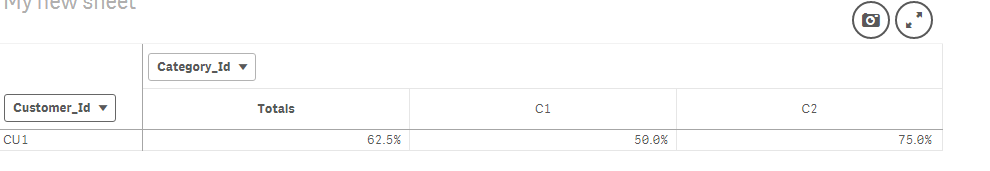
Results I need are, for each visit, the sum of the column InStock divided by the quantity of products, then aggregate using average:
| Customer_Id | TOTAL | C1 | C2 |
|---|---|---|---|
| CU1 | 62.5% = (3/4 + 2/4) / 2 | 50% = (1/2 + 1/2) / 2 | 75% = (2/2 + 1/2) / 2 |
So, if I use the expression Avg(Aggr(Sum(InStock)/Count(InStock), Visit_Id)), I successfuly got the result for TOTAL Customer, but not for each category. I tried adding the Category_Id in the agregation, but it gives me wrong result for the total since the average takes the results for each Visit and Category.
Is there any way to achieve what I want?
Any help will be very appreciate.
Best regards!
Accepted Solutions
- Mark as New
- Bookmark
- Subscribe
- Mute
- Subscribe to RSS Feed
- Permalink
- Report Inappropriate Content
Try this
Avg(Aggr(Sum(Qty)/Sum(Total <Store> Qty), Store, Manufacturer))
- Mark as New
- Bookmark
- Subscribe
- Mute
- Subscribe to RSS Feed
- Permalink
- Report Inappropriate Content
Is this in a chart with Customer_Id as dimension or do you have Category_Id as your dimension also?
- Mark as New
- Bookmark
- Subscribe
- Mute
- Subscribe to RSS Feed
- Permalink
- Report Inappropriate Content
Hi! Both, Category_Id and Customer_Id are as dimensions... to be more precisely, my visualization is a PivotTable with Customer_Id as rows and Category_Id as columns.
Regards!
- Mark as New
- Bookmark
- Subscribe
- Mute
- Subscribe to RSS Feed
- Permalink
- Report Inappropriate Content
I tried this in QlikView and this worked for me
=Sum(InStock)/Count(InStock)
Do you really need Aggr() function here?
- Mark as New
- Bookmark
- Subscribe
- Mute
- Subscribe to RSS Feed
- Permalink
- Report Inappropriate Content
Works in Qlik Sense also
- Mark as New
- Bookmark
- Subscribe
- Mute
- Subscribe to RSS Feed
- Permalink
- Report Inappropriate Content
Thankyou very much Sunny, but the Aggr is needed because the operation is not simply the Sum(InStock)/Count(InStock). I'm pretty sure this works with the provided example but not with real data.
The operation I need is calculate the Sum(InStock) / Count(InStock) for each Visit_Id. Then take every one of the results and calculate the average. This is Avg(Aggr(Sum(InStock)/Count(InStock), Visit_Id)). The problem is that this doesn't work when I add the Category as dimension because the Aggr have only 1 result for each visit, and not for each category.
I apologize if I'm not very clear.
Best regards!
- Mark as New
- Bookmark
- Subscribe
- Mute
- Subscribe to RSS Feed
- Permalink
- Report Inappropriate Content
I won't know what you mean unless you can share an example with me... but may be you want this
Avg(Aggr(Sum(InStock)/Count(InStock), Customer_Id, Category_Id, Visit_Id))
But this is just a guess... I don't really know what you are looking to get
- Mark as New
- Bookmark
- Subscribe
- Mute
- Subscribe to RSS Feed
- Permalink
- Report Inappropriate Content
After some research, I found this is a case of Aggr() grain mismatch. So I will try to explain my issue using a different approach.
I will use the next straight table for my example:
| Store | Manufacturer | Brand | Qty |
|---|---|---|---|
| A | 1 | X | 1 |
| A | 2 | Y | 1 |
| B | 1 | X | 1 |
| B | 2 | Y | 2 |
| B | 3 | Z | 1 |
| C | 1 | X | 2 |
Now, what I want to calculate is the average participation of each manufacturer by store, so, if I select explicitely the Manufacturer 1, the calculation can be acomplished using the expression Avg(Aggr(Sum(Qty)/Sum(Total<Store> Qty), Store)). Since the Manufacturer 1 is selected, the aggr function will create a temporary table with the result for each store:
| Store | Sum(Qty)/Sum(Total<Store> Qty) |
|---|---|
| A | =1 / 2 = 0.50 |
| B | = 1 / 4 = 0.25 |
| C | = 2 / 2 = 1.00 |
Then the avg function takes the results and returns (0.5 + 0.25 + 1) / 3 = 0.583
At this point, there is no problem. Problem raises when I try to use this calculation on a bar chart with the Manufacturer as my only dimension and no Manufacturer is selected since I want to see the 3 Manufacturers at the same time, something like this:
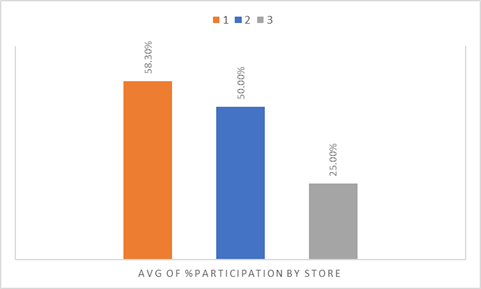
Is there any way to achieve what I want? I know that Aggr() needs to have the same dimensions as the outside dimensions, but adding Manufacturer to my expression doesn't give me the expected results.
Any help will be very appreciate.
Best Regards!
- Mark as New
- Bookmark
- Subscribe
- Mute
- Subscribe to RSS Feed
- Permalink
- Report Inappropriate Content
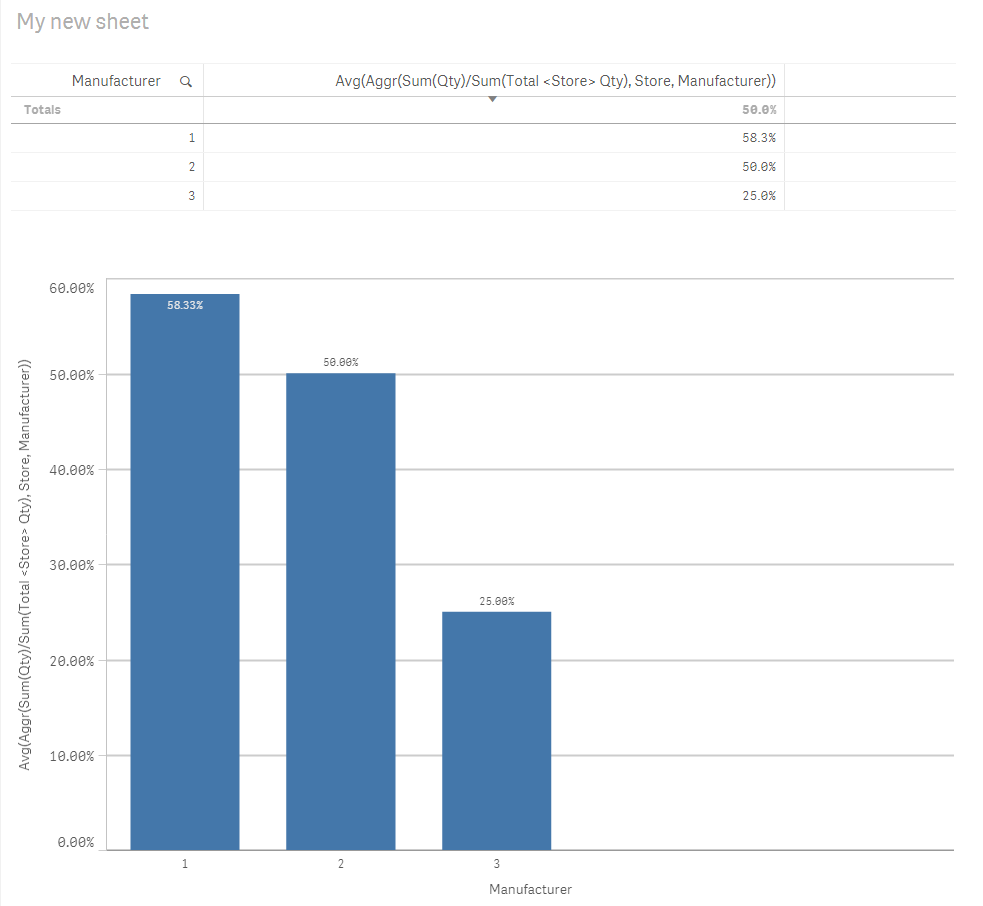
Try this
Avg(Aggr(Sum(Qty)/Sum(Total <Store> Qty), Store, Manufacturer))