Unlock a world of possibilities! Login now and discover the exclusive benefits awaiting you.
- Qlik Community
- :
- Forums
- :
- Analytics
- :
- New to Qlik Analytics
- :
- Re: Area difference chart
- Subscribe to RSS Feed
- Mark Topic as New
- Mark Topic as Read
- Float this Topic for Current User
- Bookmark
- Subscribe
- Mute
- Printer Friendly Page
- Mark as New
- Bookmark
- Subscribe
- Mute
- Subscribe to RSS Feed
- Permalink
- Report Inappropriate Content
Area difference chart
Hi All,
I want to achieve the below visualization in qlik sense:
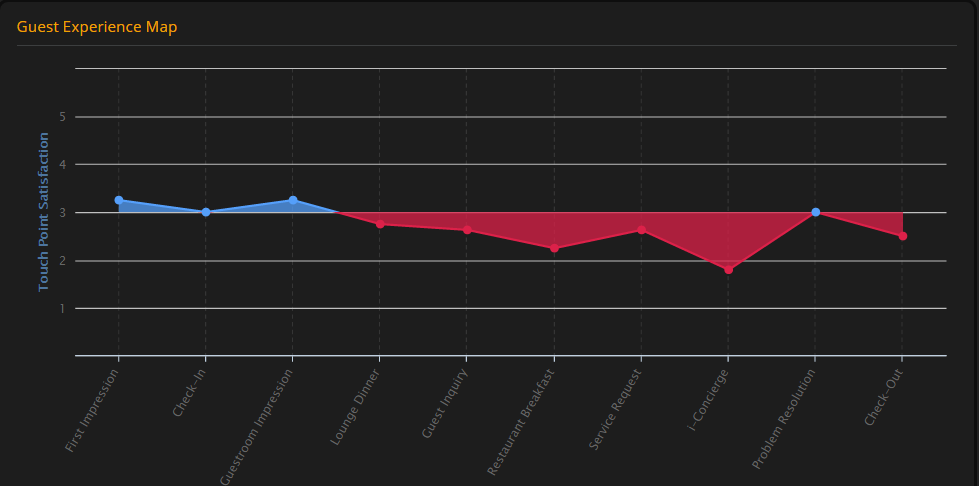
In this area chart there y axis will start from 0 only but the reference line is 3 and we have to represent if the point is above 3 than area between that point and 3 should be blue and if its less than 3 than it should be red .
Any suggestion which extension I cna use as tried with line chart but not able to achieve .
- Mark as New
- Bookmark
- Subscribe
- Mute
- Subscribe to RSS Feed
- Permalink
- Report Inappropriate Content
Test Data:
TestTable:
LOAD * Inline
[
'XValue', 'YValue',
    1, 25
    2, 21
    3, 19
    4,10
    5, 5
    6,3
    7,-4
    8,-8
    9,-15
    10, -16

]
;


EXIT Script
;
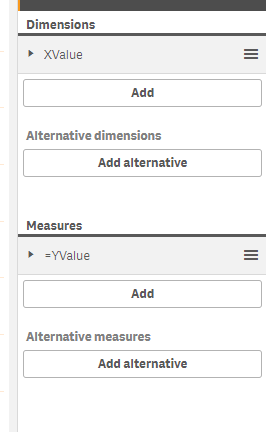
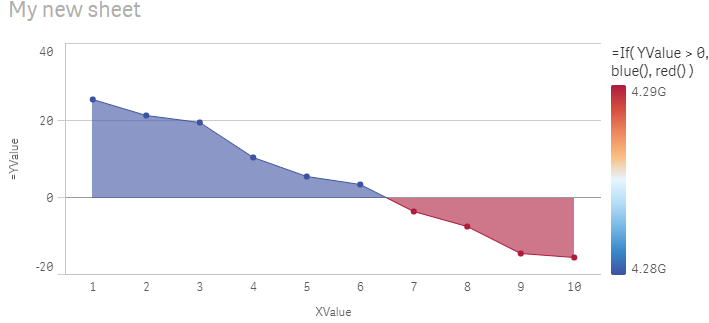
Add a Line Chart to your sheet, using the Xvalue and Yvalue for the dimension and measure.
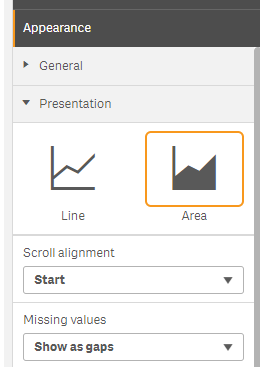
In the Chart > Appearance > Presentation, select Area.
In Appearance > Colors and Legend, select 'Custom' and 'By measure'.
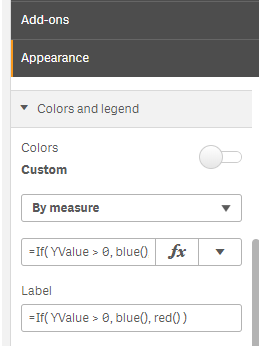
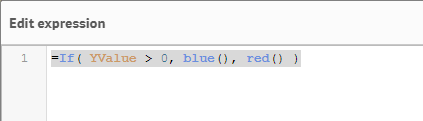
Click the fx and input
=If( YValue > 0, blue(), red() )
- Mark as New
- Bookmark
- Subscribe
- Mute
- Subscribe to RSS Feed
- Permalink
- Report Inappropriate Content
It could has been a good idea, but it's working only if reference point is 0.
Question asked of varying area color referring on 3.
I add that I'd like that colours of area could change depending on the value of another expression.
Is there some hope of achieve the goal with a simple line graph?
I find out D3 Visualization Library extension in Qlik Branch:
https://github.com/skokenes/Qlik-Sense-D3-Visualization-Library
and using Difference Chart I was able to create my chart.
Unfortunatly, I cannot change x-Axis (no scroll bar) and this is very limiting for long historical series of data.
Anyone has some other suggestion?
- Mark as New
- Bookmark
- Subscribe
- Mute
- Subscribe to RSS Feed
- Permalink
- Report Inappropriate Content
Then you change the value where your YValue changes colors.
If( YValue > 0, blue(), red() ) -> If( YValue > 3, blue(), red() )
- Mark as New
- Bookmark
- Subscribe
- Mute
- Subscribe to RSS Feed
- Permalink
- Report Inappropriate Content
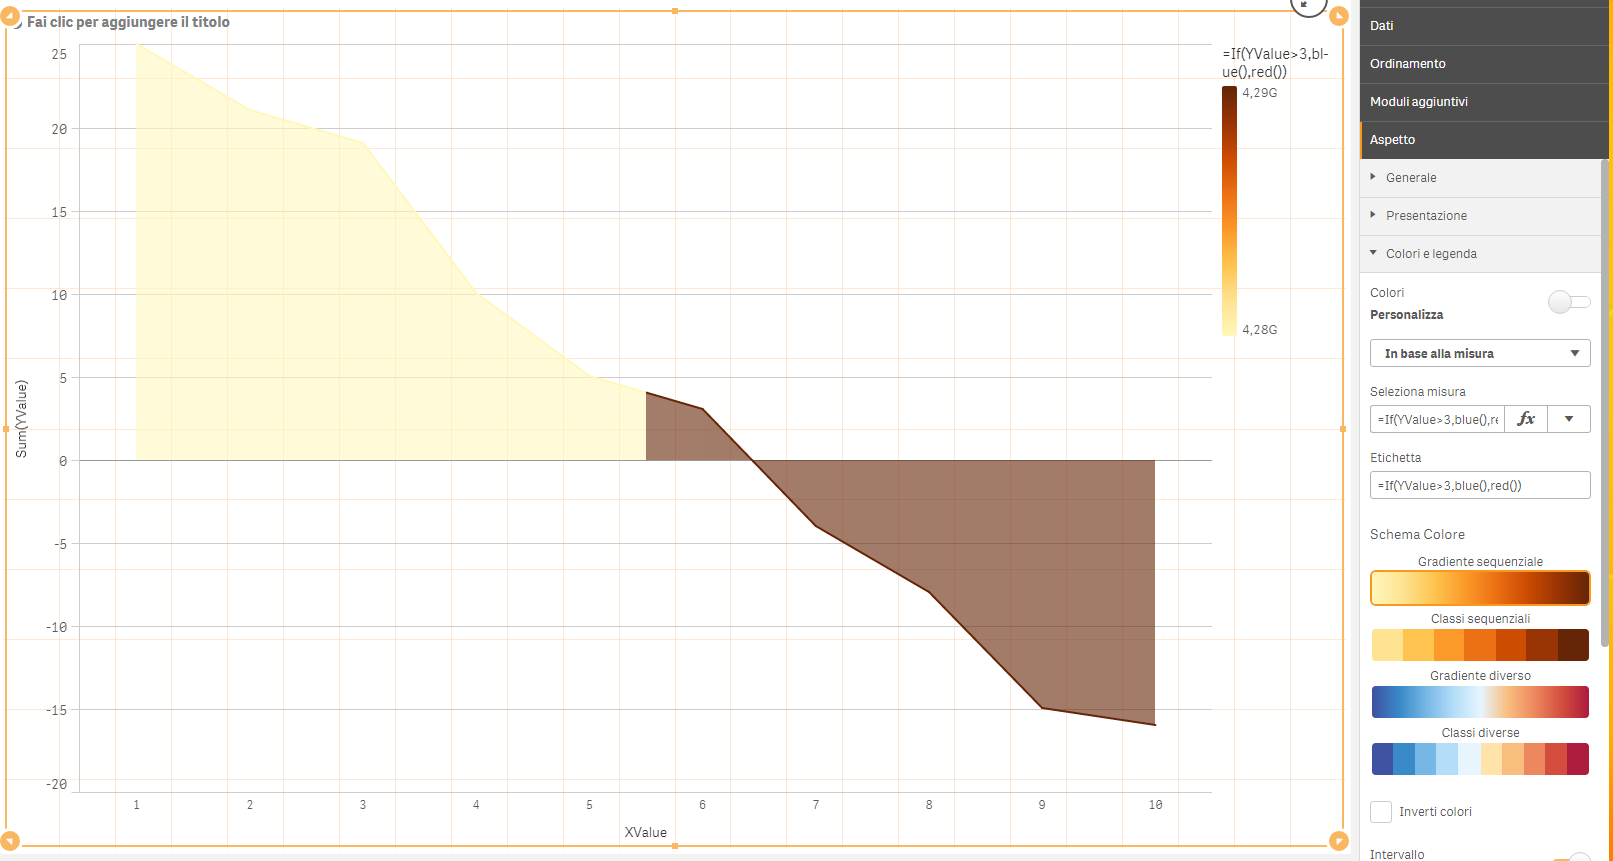
In this case, color will change at walue 3, but area will start from 0 value.
Furthermore, colors in expression don't overwrite default colors.
This is what I managed to get.
- Mark as New
- Bookmark
- Subscribe
- Mute
- Subscribe to RSS Feed
- Permalink
- Report Inappropriate Content
Hi,
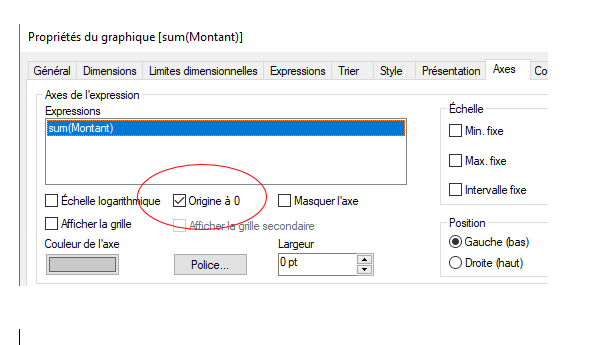
you may have still : Origin at 0
check off this option you'll have your line change color for 3
regards
- Mark as New
- Bookmark
- Subscribe
- Mute
- Subscribe to RSS Feed
- Permalink
- Report Inappropriate Content
Sorry, I can not find this option.
It's well hidden. 
- Mark as New
- Bookmark
- Subscribe
- Mute
- Subscribe to RSS Feed
- Permalink
- Report Inappropriate Content
it's here ......... in french and with QV 😉
- Mark as New
- Bookmark
- Subscribe
- Mute
- Subscribe to RSS Feed
- Permalink
- Report Inappropriate Content
Oh, ok.
No problem for French, but I need to solve this issue with Sense.