Unlock a world of possibilities! Login now and discover the exclusive benefits awaiting you.
- Qlik Community
- :
- Forums
- :
- Analytics
- :
- New to Qlik Analytics
- :
- Average per product compared to total avarege
Options
- Subscribe to RSS Feed
- Mark Topic as New
- Mark Topic as Read
- Float this Topic for Current User
- Bookmark
- Subscribe
- Mute
- Printer Friendly Page
Turn on suggestions
Auto-suggest helps you quickly narrow down your search results by suggesting possible matches as you type.
Showing results for
Not applicable
2015-11-17
09:15 AM
- Mark as New
- Bookmark
- Subscribe
- Mute
- Subscribe to RSS Feed
- Permalink
- Report Inappropriate Content
Average per product compared to total avarege
I have a set of data like this (in orange)

The average per product is in blue and know I like to calculate the 'average per product' devided by the 'total avere' and put the numbers (those in green) in a bar chart.
Example Product A:
The average is 3.5 ((5+2) / 2 ) and compared to the total average i get 92 % (3.5 / 3.8 * 100)
Example Product C:
The average is 5 ((6+4) / 2 ) and compared to the total average i get 132 % (5 / 3.8 * 100)
How do I do that?
473 Views
1 Solution
Accepted Solutions
MVP
2015-11-17
09:28 AM
- Mark as New
- Bookmark
- Subscribe
- Mute
- Subscribe to RSS Feed
- Permalink
- Report Inappropriate Content
385 Views
2 Replies
MVP
2015-11-17
09:28 AM
- Mark as New
- Bookmark
- Subscribe
- Mute
- Subscribe to RSS Feed
- Permalink
- Report Inappropriate Content
This?
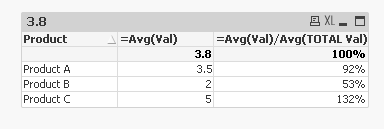
Expression 1: =Avg(Val)
Expression 2: =Avg(Val)/Avg(TOTAL Val)
386 Views
Not applicable
2015-11-18
03:22 AM
Author
- Mark as New
- Bookmark
- Subscribe
- Mute
- Subscribe to RSS Feed
- Permalink
- Report Inappropriate Content
Thanks - I wasn't aware of the 'Total function':
=Avg(Val)/Avg(TOTAL Val)
385 Views
Community Browser