Unlock a world of possibilities! Login now and discover the exclusive benefits awaiting you.
- Qlik Community
- :
- Forums
- :
- Analytics
- :
- New to Qlik Analytics
- :
- Bar Chart Count MAX AGGR() Measure Help
- Subscribe to RSS Feed
- Mark Topic as New
- Mark Topic as Read
- Float this Topic for Current User
- Bookmark
- Subscribe
- Mute
- Printer Friendly Page
- Mark as New
- Bookmark
- Subscribe
- Mute
- Subscribe to RSS Feed
- Permalink
- Report Inappropriate Content
Bar Chart Count MAX AGGR() Measure Help
Hello Community,
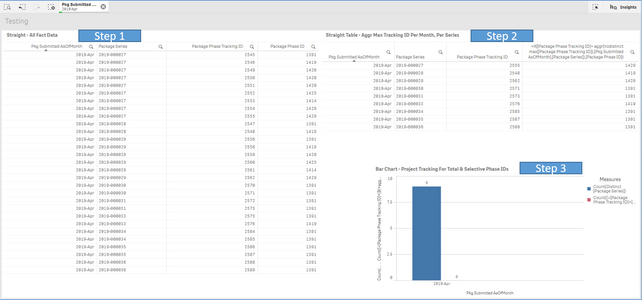
I am trying to build a bar chart that will have multiple custom measures, one of which will be based on which phase the most recent status update was submitted for various projects each month. I tried to break the project into 3 steps to ensure I was receiving the correct inputs. Attached is a slice of the data and below were the steps and a graphic with and without references.
Step 1: Make a straight table with all the fact data loaded into the app. That was a success.
Step 2: Make a straight table only showing the most recent status for each project. This was successful by utilizing the below if statement as the final dimension
=if([Package Phase Tracking ID]= aggr(nodistinct max([Package Phase Tracking ID]),[Pkg Submitted AsOfMonth],[Package Series]),[Package Phase ID])
Step 3: Make a Bar graph showing the total series in that month (successful), and another bar if that series most recent status was equal to a certain value. In the example below I'd like to set that value to 1429 but in the future may need to include other statuses in that same bar such as both (1419,1429).
Question: How do I get the red bar to count only the two orange records, in this example these are the two where the max phase tracking ID for the project has a phase id of 1429. I've tried the below code which does not work.
Count(DISTINCT {<[$(=If([Package Phase Tracking ID]= aggr(nodistinct max([Package Phase Tracking ID]),[Pkg Submitted AsOfMonth],[Package Series]),[Package Phase ID]))] = {'1429'}>}[Package Series])
Thanks a ton!

