Unlock a world of possibilities! Login now and discover the exclusive benefits awaiting you.
- Qlik Community
- :
- Forums
- :
- Analytics
- :
- New to Qlik Analytics
- :
- Bar Chart: Show different reference line according...
- Subscribe to RSS Feed
- Mark Topic as New
- Mark Topic as Read
- Float this Topic for Current User
- Bookmark
- Subscribe
- Mute
- Printer Friendly Page
- Mark as New
- Bookmark
- Subscribe
- Mute
- Subscribe to RSS Feed
- Permalink
- Report Inappropriate Content
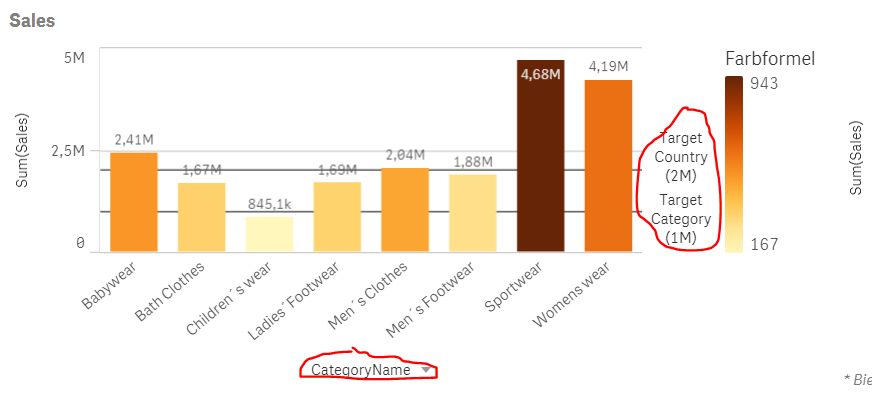
Bar Chart: Show different reference line according to selected dimension
Hello everyone,
is it possible to change the value of a reference line in a bar chart according to the selected dimension?
I was looking for something like a formular for the reference line, i.e.
if(selectedDimension = Category, 2000, if(selectedDimension = Country, 4000, 0)
Right now, I have naively "solved" this with two reference lines, but obviously this is a bad solution.
Any ideas for a solution would be nice.
Thank you
Accepted Solutions
- Mark as New
- Bookmark
- Subscribe
- Mute
- Subscribe to RSS Feed
- Permalink
- Report Inappropriate Content
indeed missing function to work with alternative dimensions/measures.
may i suggest use the "qs variable" extension:
create a variable containing your dimension name, and use that variable as dimension and as parameter in your reference line
vDimension = 'CategoryName' or 'Country' (toggle with a button in the extension)
ref line : if($(vDimension)='Country',..., ... )