Unlock a world of possibilities! Login now and discover the exclusive benefits awaiting you.
- Qlik Community
- :
- Forums
- :
- Analytics
- :
- New to Qlik Analytics
- :
- Re: Bar Chart
- Subscribe to RSS Feed
- Mark Topic as New
- Mark Topic as Read
- Float this Topic for Current User
- Bookmark
- Subscribe
- Mute
- Printer Friendly Page
- Mark as New
- Bookmark
- Subscribe
- Mute
- Subscribe to RSS Feed
- Permalink
- Report Inappropriate Content
Bar Chart
Hi all,
I have created a bar chart, where
Dimension: Client_id
Measures:
1 Count(invitation_id)
2. Count(User_signed)
and i have a filterpane in a sheet dimension as client_id.
Now without selecting any client_id from filter pane bar chart is displaying separate bars for all the clients.
Instead i need only 2 bars for above two measures which calculates for all clients.
and when i select any client in filter pane then it should show the values for that client in bars.
How can i achieve this.
Thanks,
Pramod
- Tags:
- bar charts
Accepted Solutions
- Mark as New
- Bookmark
- Subscribe
- Mute
- Subscribe to RSS Feed
- Permalink
- Report Inappropriate Content
Hi Pramod,
Just wanted to find out if this is not working
Dimension: =if(GetSelectedCount(Client_id)=0,'Client ID',Client_id)
- Mark as New
- Bookmark
- Subscribe
- Mute
- Subscribe to RSS Feed
- Permalink
- Report Inappropriate Content
you can use KPI object or text object to show the measures. and with filter this will cater your requirement.
- Mark as New
- Bookmark
- Subscribe
- Mute
- Subscribe to RSS Feed
- Permalink
- Report Inappropriate Content
Hi Pramod,
If you choose Client_id as a dimension, your bar chart will show measure values per dimension.
If you would like to show the "Total" as requested, you could add a dimension i.e. 'All Clients' (text instead of a field).
- Mark as New
- Bookmark
- Subscribe
- Mute
- Subscribe to RSS Feed
- Permalink
- Report Inappropriate Content
can you explain how can i do that
- Mark as New
- Bookmark
- Subscribe
- Mute
- Subscribe to RSS Feed
- Permalink
- Report Inappropriate Content
use seperate text object for both measures if yu use client id as dimesion in bar chart it will show for all the clients
- Mark as New
- Bookmark
- Subscribe
- Mute
- Subscribe to RSS Feed
- Permalink
- Report Inappropriate Content
Change your dimension like this.
=if(GetSelectedCount(Client_id)=0,'Client ID',Client_id)
and let me know if this is working
Cheers,
Naresh
- Mark as New
- Bookmark
- Subscribe
- Mute
- Subscribe to RSS Feed
- Permalink
- Report Inappropriate Content
Hi Pramod,
Do it this way:
Check the QVF for more details
Thanks and Regards,
Sangram Reddy.
- Mark as New
- Bookmark
- Subscribe
- Mute
- Subscribe to RSS Feed
- Permalink
- Report Inappropriate Content
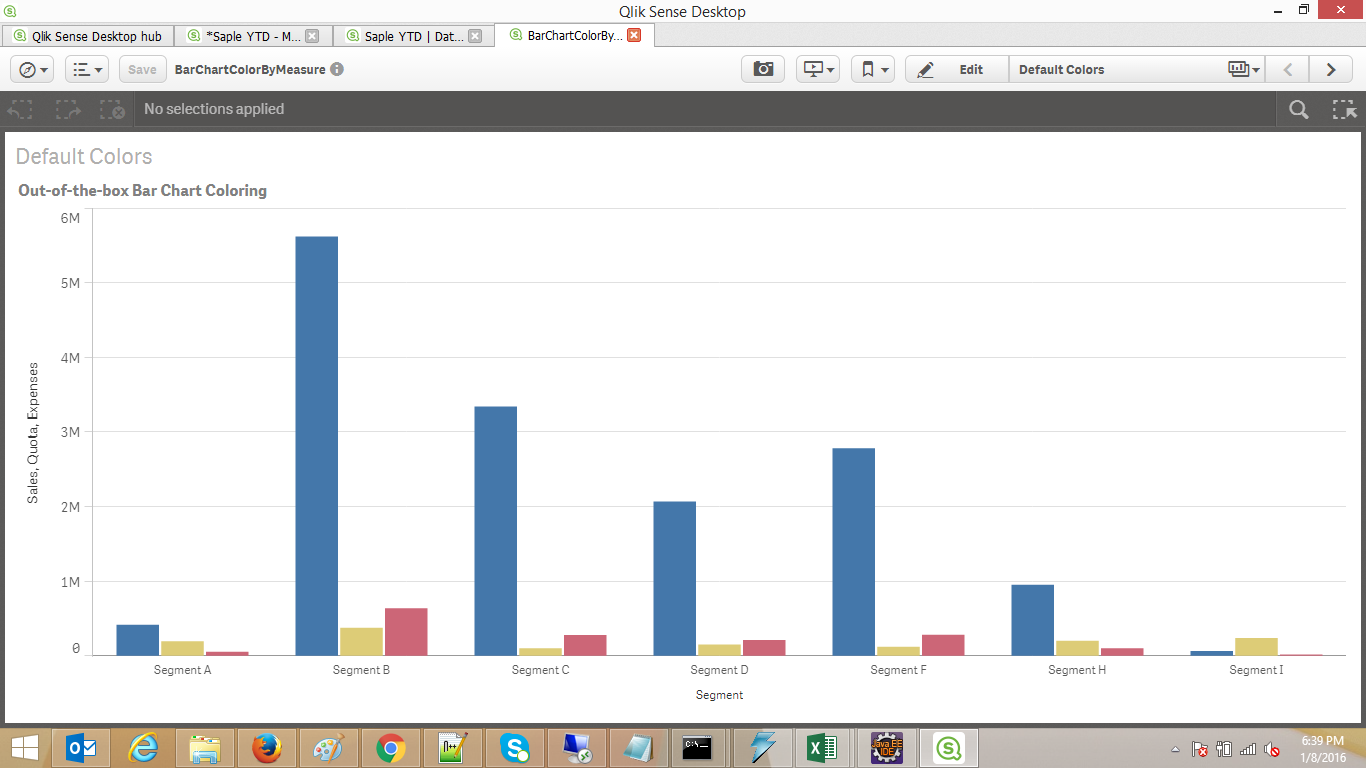
Sangram,
You have only one measure but i have 4 bars for one client.
lets take segment A as one client and 3 bars are different counts, So for 7 clients bars are displaying.
Instead 7 groups of bar just 3 bars which gives the total of 7 clients.
and when one single client is selected through filter pane only the counts of that client should show in bars.
Below image is used as example
- Mark as New
- Bookmark
- Subscribe
- Mute
- Subscribe to RSS Feed
- Permalink
- Report Inappropriate Content
Hi Pramod,
Just wanted to find out if this is not working
Dimension: =if(GetSelectedCount(Client_id)=0,'Client ID',Client_id)