Unlock a world of possibilities! Login now and discover the exclusive benefits awaiting you.
- Qlik Community
- :
- Forums
- :
- Analytics
- :
- New to Qlik Analytics
- :
- Bar chart color help
- Subscribe to RSS Feed
- Mark Topic as New
- Mark Topic as Read
- Float this Topic for Current User
- Bookmark
- Subscribe
- Mute
- Printer Friendly Page
- Mark as New
- Bookmark
- Subscribe
- Mute
- Subscribe to RSS Feed
- Permalink
- Report Inappropriate Content
Bar chart color help
Hi Experts,
Can any one please help me on below requirement.
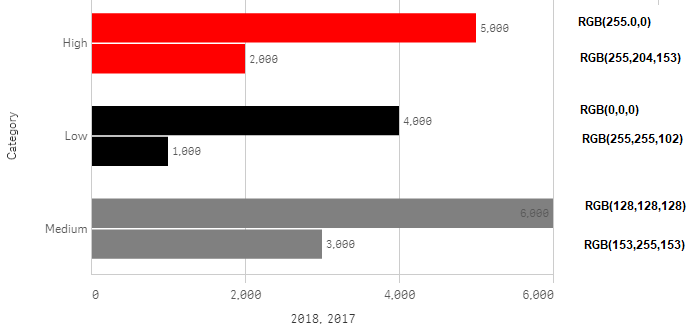
I have a bar chart with
1Dimension : Category
2Measures : =Sum({<Year={$(=Max(Year))}>}sales)
=Sum({<Year={$(=Max(Year)-1)}>}sales)
I have to apply below specified colors for each bar.
I have tried color by expression based on dimension like below.
=if(Category='Low',RGB(0,0,0),
if(Category='High',RGB(255,0,0),
if(Category='Medium',RGB(128,128,128)
)))
By the above expression 2017 and 2018 High bars getting red color but need to show 2018 High bar as red and 2017 High bar as orange.
Please help me on this. Please find the attached app.
Thanks in advance.
Accepted Solutions
- Mark as New
- Bookmark
- Subscribe
- Mute
- Subscribe to RSS Feed
- Permalink
- Report Inappropriate Content
Given the solution in the attached application,
this may be help you. ! !
- Mark as New
- Bookmark
- Subscribe
- Mute
- Subscribe to RSS Feed
- Permalink
- Report Inappropriate Content
Given the solution in the attached application,
this may be help you. ! !