Unlock a world of possibilities! Login now and discover the exclusive benefits awaiting you.
- Qlik Community
- :
- Forums
- :
- Analytics
- :
- New to Qlik Analytics
- :
- Re: Bar chart for Fiscal Year
- Subscribe to RSS Feed
- Mark Topic as New
- Mark Topic as Read
- Float this Topic for Current User
- Bookmark
- Subscribe
- Mute
- Printer Friendly Page
- Mark as New
- Bookmark
- Subscribe
- Mute
- Subscribe to RSS Feed
- Permalink
- Report Inappropriate Content
Bar chart for Fiscal Year
Hello, good afternoon!
I was having trouble drawing two temporary bar charts.
The following is the table that I must show in the two graphs.
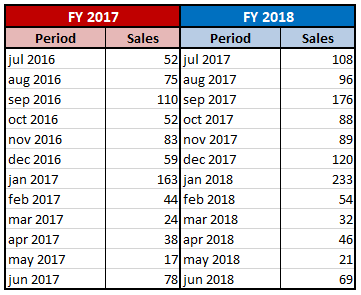
Before starting, it is important to clarify that I have the following filter pane: YEAR, MONTH and DAY. Both YEAR and MONTH are extensions of filter pane where I can always mark a selected value by default.
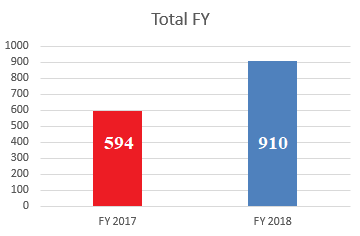
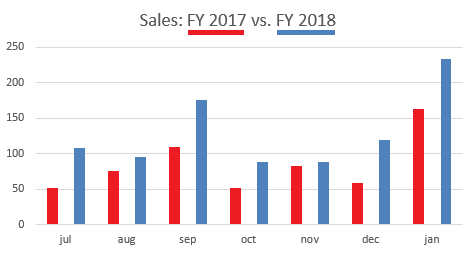
I pass them how the two graphs should look based on the selection of YEAR = 2018 and MONTH = jan.
It is important to clarify, that I have more FY in the original base, which did not happen because it is large. So I enclose the table with the format of dates that I am using.
| FISCAL_YEAR | YEAR_DATE | PERIOD_DATE | MONTH_DATE |
| FY 2017 | 2016 | jul 2016 | jul |
| FY 2017 | 2016 | aug 2016 | aug |
| FY 2017 | 2016 | sep 2016 | sep |
| FY 2017 | 2016 | oct 2016 | oct |
| FY 2017 | 2016 | nov 2016 | nov |
| FY 2017 | 2016 | dec 2016 | dec |
| FY 2017 | 2017 | jan 2017 | jan |
| FY 2017 | 2017 | feb 2017 | feb |
| FY 2017 | 2017 | mar 2017 | mar |
| FY 2017 | 2017 | apr 2017 | apr |
| FY 2017 | 2017 | may 2017 | may |
| FY 2017 | 2017 | jun 2017 | jun |
| FY 2018 | 2017 | jul 2017 | jul |
| FY 2018 | 2017 | aug 2017 | aug |
| FY 2018 | 2017 | sep 2017 | sep |
| FY 2018 | 2017 | oct 2017 | oct |
| FY 2018 | 2017 | nov 2017 | nov |
| FY 2018 | 2017 | dec 2017 | dic |
| FY 2018 | 2018 | jan 2018 | jan |
| FY 2018 | 2018 | feb 2018 | feb |
| FY 2018 | 2018 | mar 2018 | mar |
| FY 2018 | 2018 | apr 2018 | apr |
| FY 2018 | 2018 | may 2018 | may |
| FY 2018 | 2018 | jun 2018 | jun |
I already appreciate any kind of help you can give me.
Regards,
Martin.
- Mark as New
- Bookmark
- Subscribe
- Mute
- Subscribe to RSS Feed
- Permalink
- Report Inappropriate Content
Check out VizLib their charts are so simple I am sure they'll help you with this.
- Mark as New
- Bookmark
- Subscribe
- Mute
- Subscribe to RSS Feed
- Permalink
- Report Inappropriate Content
Thanks but what I need I can get it for the graphics that Qlik Sense brings. The problem that I have goes through the analysis set ...
- Mark as New
- Bookmark
- Subscribe
- Mute
- Subscribe to RSS Feed
- Permalink
- Report Inappropriate Content
Hi,
so you are asking how to create more measures, each showing only one fiscal year?
use it like this Sum({$<FISCAL_YEAR={'FY 2017'}>}Sales) and of course just change FY year name 
And if you select some month than you want to see sum of sales for months before and including selected month? In your exemple you claim selection of year 2018 in field YEAR_DATE AND jan in field MONTH_DATE? If yes than, I do not understand logic of displaying your charts. I would expect output only 233 for only FY 2018. Could you please clarify?