Unlock a world of possibilities! Login now and discover the exclusive benefits awaiting you.
- Qlik Community
- :
- Forums
- :
- Analytics
- :
- New to Qlik Analytics
- :
- Re: Bar graphic
- Subscribe to RSS Feed
- Mark Topic as New
- Mark Topic as Read
- Float this Topic for Current User
- Bookmark
- Subscribe
- Mute
- Printer Friendly Page
- Mark as New
- Bookmark
- Subscribe
- Mute
- Subscribe to RSS Feed
- Permalink
- Report Inappropriate Content
Bar graphic
Good afternoon, I need help with the following.
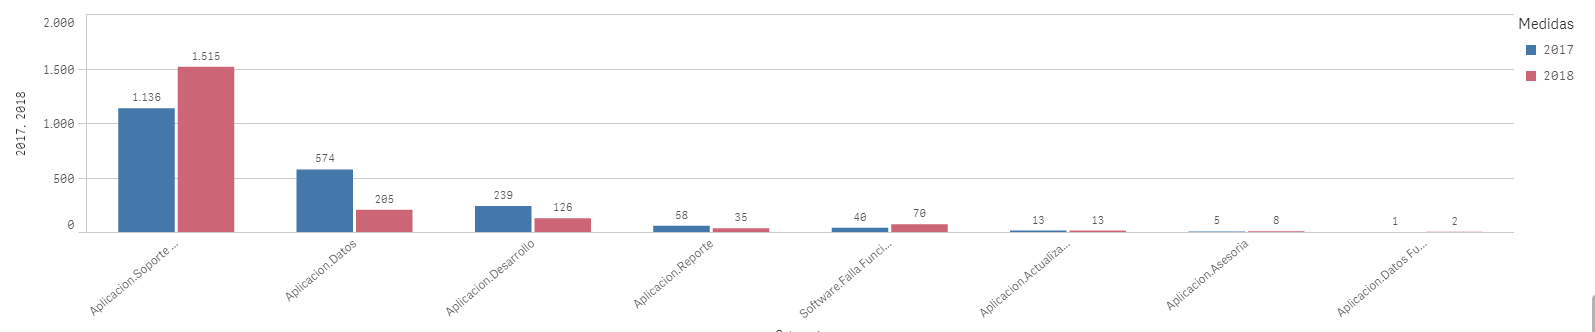
In the attached file you can see a bar graph, which in the X axis has task categories, and in the year 2017 and 2018, the bars in the amount of tasks performed in 2017 and 2018.
What I need is what I show in the X axis task but on the Y axis in the place of showing numbers, I show each of the months of the year, and the bars that show the amounts of activities performed. In other words, the only thing I need to modify in this chart is the Y axis to show the months of the year.
This can be done? How can I do it?
- Mark as New
- Bookmark
- Subscribe
- Mute
- Subscribe to RSS Feed
- Permalink
- Report Inappropriate Content
Can you use MS Paint to show us what you mean? Or use Greenshot or MS paint to modify the graphic attached to show us what you are looking for?
- Mark as New
- Bookmark
- Subscribe
- Mute
- Subscribe to RSS Feed
- Permalink
- Report Inappropriate Content
Look at the graphic attachment as I need it to be
- Mark as New
- Bookmark
- Subscribe
- Mute
- Subscribe to RSS Feed
- Permalink
- Report Inappropriate Content
Sum({<Year={2019}>} AMount)
Sum({<Year={2018}>} AMount)