Unlock a world of possibilities! Login now and discover the exclusive benefits awaiting you.
- Qlik Community
- :
- Forums
- :
- Analytics
- :
- New to Qlik Analytics
- :
- Barchart a count of distinct records YTD and Past ...
- Subscribe to RSS Feed
- Mark Topic as New
- Mark Topic as Read
- Float this Topic for Current User
- Bookmark
- Subscribe
- Mute
- Printer Friendly Page
- Mark as New
- Bookmark
- Subscribe
- Mute
- Subscribe to RSS Feed
- Permalink
- Report Inappropriate Content
Barchart a count of distinct records YTD and Past year
Hi, I saw some similar questions & answers, but none was helping me... so thanks for helping.
I have a table with some records, N. and Type that I count distinct to chart, based on a date.
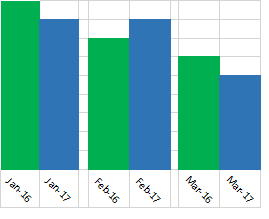
I'd like to have a bar chart that plots the count for each month (like I can do now) and also for the same month the previous year. I.e.
My data is like:
| N. | Type | Date |
|---|---|---|
| 1234 | A | 01/01/17 |
| 5678 | A | 01/01/16 |
| 8906 | A | 01/01/18 |
| 8906 | B | 01/02/18 |
So, the need of the distinct is because I want to count the same N. if a different type.
Any insight is appreciated.
Maurizio
Accepted Solutions
- Mark as New
- Bookmark
- Subscribe
- Mute
- Subscribe to RSS Feed
- Permalink
- Report Inappropriate Content
Under sorting you might try using a custom expression like:
=MONTH([Date]) & '/' & YEAR([Date])
- Mark as New
- Bookmark
- Subscribe
- Mute
- Subscribe to RSS Feed
- Permalink
- Report Inappropriate Content
Under sorting you might try using a custom expression like:
=MONTH([Date]) & '/' & YEAR([Date])
- Mark as New
- Bookmark
- Subscribe
- Mute
- Subscribe to RSS Feed
- Permalink
- Report Inappropriate Content
addmonths(date,-12)