Unlock a world of possibilities! Login now and discover the exclusive benefits awaiting you.
Announcements
Live today at 11 AM ET. Get your questions about Qlik Connect answered, or just listen in.
SIGN UP NOW
- Qlik Community
- :
- Forums
- :
- Analytics
- :
- New to Qlik Analytics
- :
- Re: Boxplot
Options
- Subscribe to RSS Feed
- Mark Topic as New
- Mark Topic as Read
- Float this Topic for Current User
- Bookmark
- Subscribe
- Mute
- Printer Friendly Page
Turn on suggestions
Auto-suggest helps you quickly narrow down your search results by suggesting possible matches as you type.
Showing results for
Contributor II
2019-03-21
10:45 PM
- Mark as New
- Bookmark
- Subscribe
- Mute
- Subscribe to RSS Feed
- Permalink
- Report Inappropriate Content
Boxplot
Hi all ,
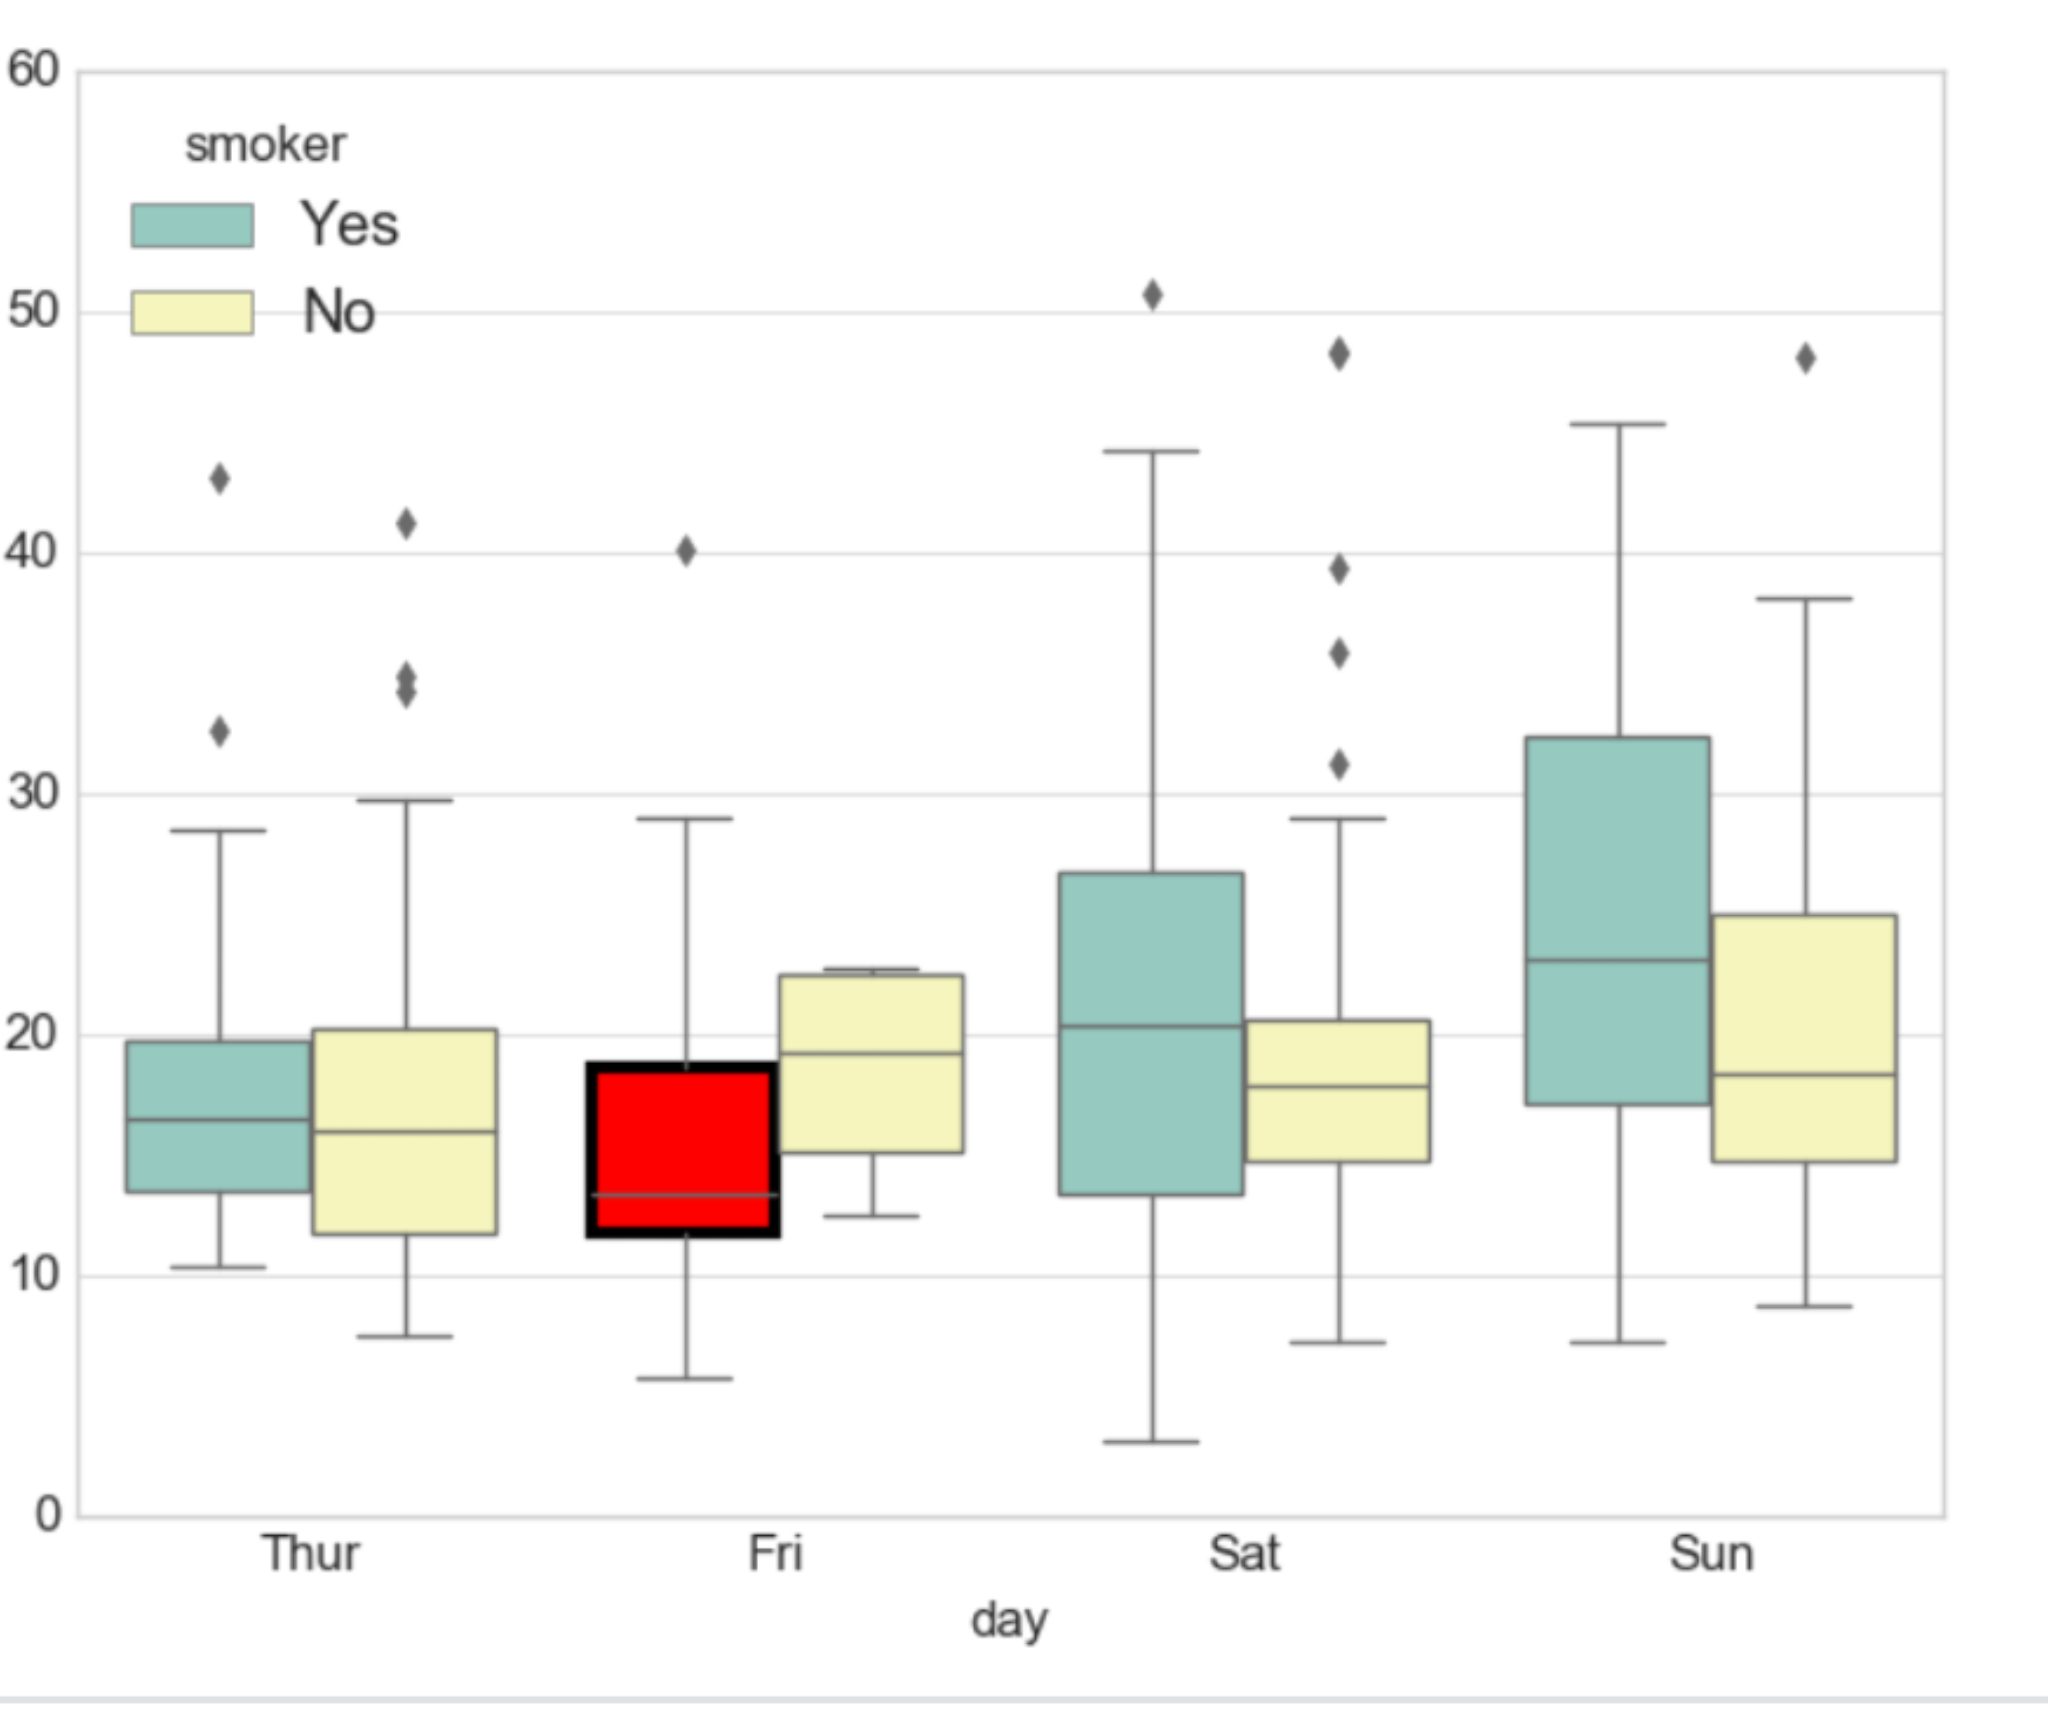
I have just started using qliksense to analyse some environmental data and I was trying to get some box-plots out. I seem to be hitting a wall when it comes to generating grouped box-plots.
I've attached an image on how I want my data to look like for info.
I have just started using qliksense to analyse some environmental data and I was trying to get some box-plots out. I seem to be hitting a wall when it comes to generating grouped box-plots.
I've attached an image on how I want my data to look like for info.
1,788 Views
6 Replies
Specialist III
2019-03-21
10:59 PM
- Mark as New
- Bookmark
- Subscribe
- Mute
- Subscribe to RSS Feed
- Permalink
- Report Inappropriate Content
attach sample data
Channa
1,781 Views
MVP
2019-03-21
11:33 PM
- Mark as New
- Bookmark
- Subscribe
- Mute
- Subscribe to RSS Feed
- Permalink
- Report Inappropriate Content
post an sample file with data , that will help us to identify the issue
1,776 Views
Contributor II
2019-03-22
12:31 AM
Author
- Mark as New
- Bookmark
- Subscribe
- Mute
- Subscribe to RSS Feed
- Permalink
- Report Inappropriate Content
Here is some sample data .
Thanks much
Thanks much
1,766 Views
Employee
2019-03-22
08:13 AM
- Mark as New
- Bookmark
- Subscribe
- Mute
- Subscribe to RSS Feed
- Permalink
- Report Inappropriate Content
Hi Amdevan,
There is no grouped box plot as native object in Sense. Instead you would have to concat your two dimensions together as one.

Patrik.
1,740 Views
Contributor II
2019-03-22
09:44 AM
Author
- Mark as New
- Bookmark
- Subscribe
- Mute
- Subscribe to RSS Feed
- Permalink
- Report Inappropriate Content
Can time be configured on the x axis?
1,733 Views
Employee
2019-03-22
10:23 AM
- Mark as New
- Bookmark
- Subscribe
- Mute
- Subscribe to RSS Feed
- Permalink
- Report Inappropriate Content
You can pick whichever dimension you want on the x-axis and concat it with any other dimension.
1,728 Views
Community Browser