Unlock a world of possibilities! Login now and discover the exclusive benefits awaiting you.
- Qlik Community
- :
- Forums
- :
- Analytics
- :
- New to Qlik Analytics
- :
- Re: Budget per production day per dimensions
- Subscribe to RSS Feed
- Mark Topic as New
- Mark Topic as Read
- Float this Topic for Current User
- Bookmark
- Subscribe
- Mute
- Printer Friendly Page
- Mark as New
- Bookmark
- Subscribe
- Mute
- Subscribe to RSS Feed
- Permalink
- Report Inappropriate Content
Budget per production day per dimensions
Hi,
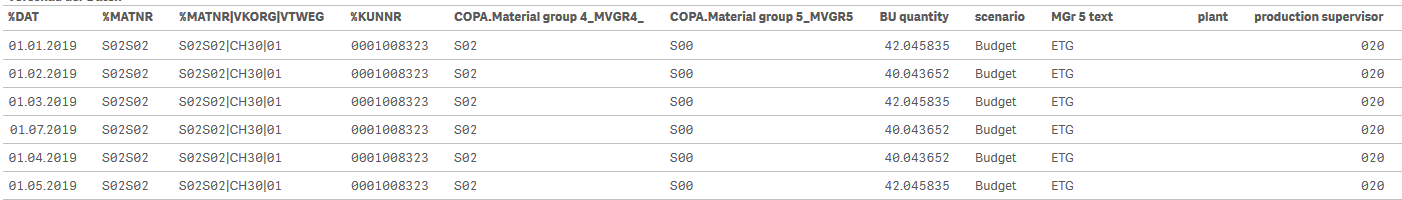
I have two tables (attached you can find them),
- the fact table with the budget figures based on
- month and year
- a generated date (01&'month'&'year')
- material
- client
- plant
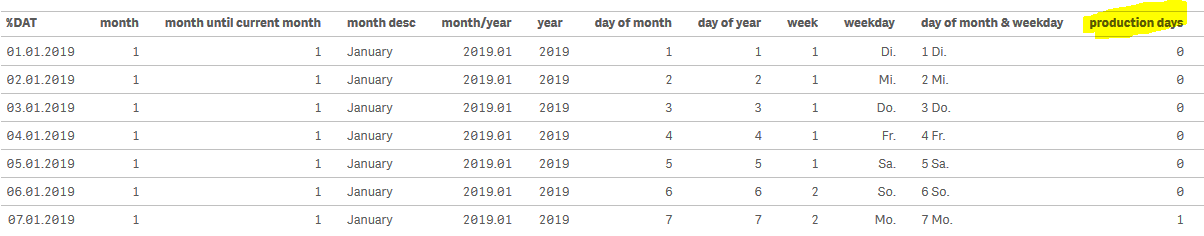
- the calendar with
- date, month, year
- the production days per day (1 for production day, 0 is not a production day).
They are connected with the key "date".
My goal is to sum up the budget for the year and divide it with the production days, so I get a new budget based on the production days.
With this formula I get the right figures per month:
Sum({$<[COPA.Material group 4_MVGR4_]-={'Q99'},plant={'CH30'}>}total[BU quantity])
/
sum(total[production days])
*
sum([production days])
But if I want to use filter like material or client the figures are wrong. You have any ideas to solve my problem?
Thanks a lot,
Lisa
- Tags:
- total
- Subscribe by Topic:
-
Qlik Sense
-
Set Analysis
-
sum per production days per dimensions
- Mark as New
- Bookmark
- Subscribe
- Mute
- Subscribe to RSS Feed
- Permalink
- Report Inappropriate Content
The data model doesn't match your desired logic. When you drill down on something like client it's reducing the data set to only the first of the month and the other days in the month with their production days are ignored.
One approach could be to use aggr and {1} as your set analysis in expressions, but this would be fiddly and unique per chart.
A simpler approach would be to rollup the calendar to being one record per month with the number of productions days being aggregated.
- Mark as New
- Bookmark
- Subscribe
- Mute
- Subscribe to RSS Feed
- Permalink
- Report Inappropriate Content
I found a solution: add e.g. month= to the measure.