Unlock a world of possibilities! Login now and discover the exclusive benefits awaiting you.
- Qlik Community
- :
- Forums
- :
- Analytics
- :
- New to Qlik Analytics
- :
- Re: Bug in nPrinting 18
- Subscribe to RSS Feed
- Mark Topic as New
- Mark Topic as Read
- Float this Topic for Current User
- Bookmark
- Subscribe
- Mute
- Printer Friendly Page
- Mark as New
- Bookmark
- Subscribe
- Mute
- Subscribe to RSS Feed
- Permalink
- Report Inappropriate Content
Bug in nPrinting 18
Hi All
I am posting up a bug I have found in nPrinting:
Qlik NPrinting September 2018 SR2
Version: 18.29.9.0
I am also on Qlik Sense Sep-18.
It has taken me a day to fix this issue, but trial and error, so I thought I would share this knowledge.
I have upgraded from a prior version of nPrinting (circa Jun-17) to the above mentioned version. Suddenly reports that ran perfect in the past now have blank charts, or the reports simply fail in nPrinting.
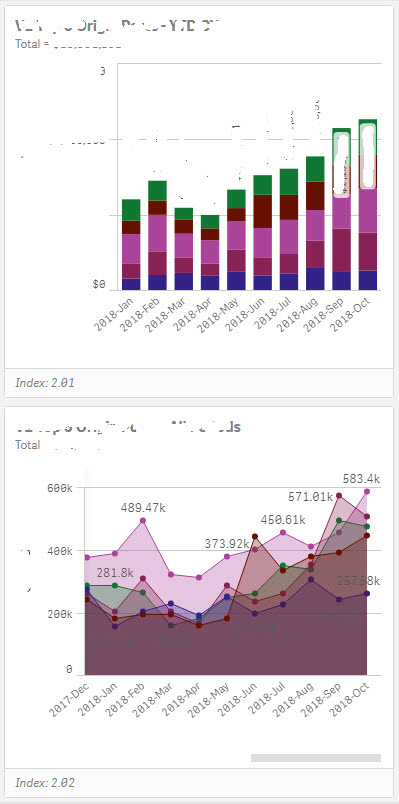
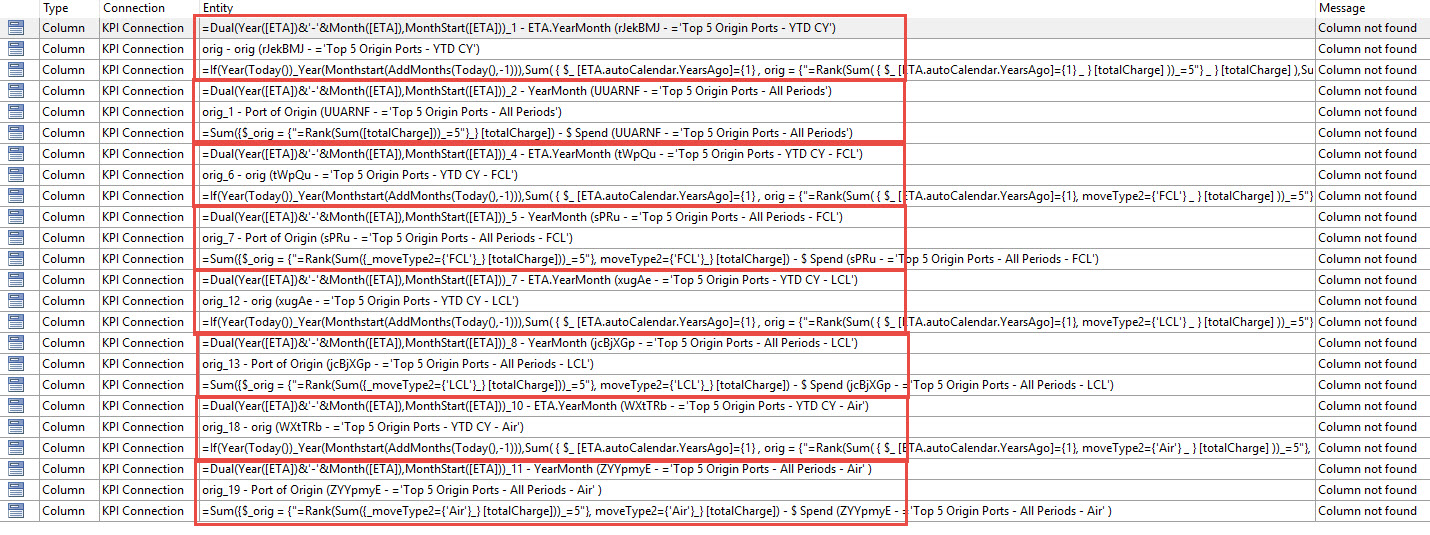
The issue is that nPrinting 18 cannot seem to manage itself when it is referencing a stacked bar chart in Qlik Sense, and also line charts where there are e.g. 2 dimensions creating a lot of lines. I have several KPI apps in Sense that have these charts, and in old nPrinting, it could handle it no problem. nPrinting would take the data from Sense and display it in nPrinting (in Excel shell).
Example of the type of visuals I am talking about are standard Qlik Sense visuals:
During my trials to resolve I observed the following.
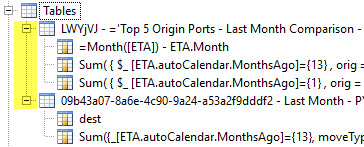
Opening nPrinting report now shows you where it decides the errors are - I put the red squares around each set of data fields that related to each Sense visualization otherwise its a nightmare to read:
It gives you options to remove individual errors, or all at once, but you can also just 'ok' without selecting any to remove, or just cancel to get into nPrinting designer (in excel in my case).
Because nPrinting errors are quite challenging to resolve in my opinion, I did a few things like found the object already in the list of tables, right clicked, and then clicked 'update' to see if that would help, and for all the above errors, the object changes from a normal looking object like this:
.......to this.......
(Note these 2 images are not the actual images, they are just to highlight the change seen).
Note: these objects can no longer be expanded like a tree/hierarchy, so detailed manipulation in nPrinting cannot be done. As I'm trying to retro fit these updates into the existing structure of the report in nPrinting, this makes it impossible/really hard to continue.
My need was to get the data to be available in nPrinting with that hierarchy/tree structure available.
So I cancelled out of nPrinting without saving....a great lesson learned from mistakes of the past!
What I discovered after a lot of trialing, is that what had to happen was to open the Sense App, and convert the stacked bar chart and the line charts to tables, by simply dragging the table icon and dropping it on the existing chart visual....pretty standard Sense stuff. Once I had converted all the relevant charts, I reloaded the entire data set into Sense via Sense Data Load Editor, and then did a reload of metadata in nPrinting. (Note, just doing the metadata reload in nPrinting wasn't dragging the data through for some reason, but reloading the app, then reloading metadata seemed to do it......another bug?)
Next I opened up the report in nPrinting, and the massive list of errors was gone, however in running/previewing the report to produce output, there was still some blank charts, the same as initially.
So next, I found each object that had been listed in the list of errors above, and I updated each one (right click, Update), and although nPrint said there was nothing to update, something was happening in the background as it hung each time I did this for about 5 seconds, and then the cursor went to the top of the list - not seen that before in nPrint when there is no update!
Next, I located each object in the list and dragged the necessary fields back to the existing cells in the Excel Editor where they were originally located and just dropped over the top . Once all done I saved and closed the editor.
Then I ran my task linked to the report, and it pulled everything through 100% ok.
This took me ages to find out, by trial and error, and it was very frustrating. It was totally unobvious to me that this needed to happen.
It seems there is a bug in nPrinting that should be ironed out to ensure that compatibility between standard Sense objects and nPrinting exists and is 100% stable for all interations of charts.
I hope I save someone else the pain of spending a day trouble shooting this issue.
- Mark as New
- Bookmark
- Subscribe
- Mute
- Subscribe to RSS Feed
- Permalink
- Report Inappropriate Content
Hi Giles,
I believe this should actually be posted in NPrinting community (not Qlik Sense).
You have put a lot of effort to recreate, debug and put it all together. Did you open support case with Qlik support regarding this?
I am tagging Daniel djk and Ruggero rpc here as it is worth checking with them if they are aware of this behavior
cheers
Lech
- Mark as New
- Bookmark
- Subscribe
- Mute
- Subscribe to RSS Feed
- Permalink
- Report Inappropriate Content
Hi Giles,
Thanks for your great effort to understand the issue and describe it. It is very useful to have this level of details.
My suggestion in this and similar cases is to open a support ticket instead of a community post. The reason is that via ticket you can attach your environment and you are that it will be keep secret and we can reproduce your issue directly to investigate and resolve it. The result will be published in the release notes of the Qlik NPrinting version that resolves the bug, if the check will confirm that it is a bug.
Best Regards,
Ruggero
---------------------------------------------
When applicable please mark the appropriate replies as CORRECT https://community.qlik.com/docs/DOC-14806. This will help community members and Qlik Employees know which discussions have already been addressed and have a possible known solution. Please mark threads as HELPFUL if the provided solution is helpful to the problem, but does not necessarily solve the indicated problem. You can mark multiple threads as HELPFUL if you feel additional info is useful to others.
Best Regards,
Ruggero
---------------------------------------------
When applicable please mark the appropriate replies as CORRECT. This will help community members and Qlik Employees know which discussions have already been addressed and have a possible known solution. Please mark threads with a LIKE if the provided solution is helpful to the problem, but does not necessarily solve the indicated problem. You can mark multiple threads with LIKEs if you feel additional info is useful to others.
- Mark as New
- Bookmark
- Subscribe
- Mute
- Subscribe to RSS Feed
- Permalink
- Report Inappropriate Content
Hi,
Check that you are not in this case:
Qlik Sense tables with conditionally shown columns have limited functionality
The following functionalities are not supported for Qlik Sense tables that have a "Show column if" condition
set on one or more of their columns: Levels, single column export, and keep source formats.
That is a know limitation.
Best Regards,
Ruggero
---------------------------------------------
When applicable please mark the appropriate replies as CORRECT https://community.qlik.com/docs/DOC-14806. This will help community members and Qlik Employees know which discussions have already been addressed and have a possible known solution. Please mark threads as HELPFUL if the provided solution is helpful to the problem, but does not necessarily solve the indicated problem. You can mark multiple threads as HELPFUL if you feel additional info is useful to others.
Best Regards,
Ruggero
---------------------------------------------
When applicable please mark the appropriate replies as CORRECT. This will help community members and Qlik Employees know which discussions have already been addressed and have a possible known solution. Please mark threads with a LIKE if the provided solution is helpful to the problem, but does not necessarily solve the indicated problem. You can mark multiple threads with LIKEs if you feel additional info is useful to others.
- Mark as New
- Bookmark
- Subscribe
- Mute
- Subscribe to RSS Feed
- Permalink
- Report Inappropriate Content
Hi Ruggero
Thanks - I am not using the function to 'show columns conditionally'. I will try to log a support ticket.
Rgds
Giles
- Mark as New
- Bookmark
- Subscribe
- Mute
- Subscribe to RSS Feed
- Permalink
- Report Inappropriate Content
- Mark as New
- Bookmark
- Subscribe
- Mute
- Subscribe to RSS Feed
- Permalink
- Report Inappropriate Content
Ticket logged and Qlik Support are looking into it
- Mark as New
- Bookmark
- Subscribe
- Mute
- Subscribe to RSS Feed
- Permalink
- Report Inappropriate Content
Update 3rd Dec 2018
After consulting with Qlik Support, their feedback is that the interaction between Qlik Sense and nPrinting is working as they intend! This wasn't what I was expecting to hear!
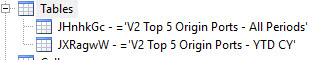
From their explanation, what I understand is that a stacked bar chart and a multi line chart (ie a chart with e.g. 5 lines on) takes on the same characteristics as a pivot table. What this means is that when the object is imported to nPrinting editor (in my case Excel), it is designed to be visible as a singlar object in the list of tables, with no access to the underlying fields. By this, I mean that the view below in nPrinting is deemed correct :

You will note that you cannot expand the table objects to see underlying data columns.
They showed me a way of telling how an object will behave in nPrinting, by simply exporting the data from Sense to Excel. When exporting a stacked bar chart the visible export looks like the below image - I have highlighted the visual cue where this shows it's underlying pivot table type properties - grey colouring in first 2 columns, and no colouring in the values column:

This is different in appearance to the grouped bar chart (not stacked), that looks like this - note the grey colouring is removed indicating this does not have pivot table properties, and simply has standard table properties:

When challenged they weren't able to advise which release version this change took place in, or if it was communicated in release notes. It may have been, but without detailed investigation (which I am not doing) we won't know for sure.
Personally I think this design has short comings, and drives inconsistency into how you create future proofed nPrinting reports. I think the main thing I have learned here, is that if I am going to be feeding data to nPrinting from Sense, and using Excel as my editor, all my Sense objects need to be standard tables only, and any/all visualisations should be created in Excel only for the Excel output. Whilst this sounds a bit short sighted, until you can import and properly re-scale Sense visuals into the Excel editor, and get decent reprint quality definition without having to blow your file size with changing the output quality, reproduction via Excel is the only way forward that will satisfy our business and clients.
The 1 fortunate thing in amongst this, is that nPrinting now tells you the tables you get any errors in, which is a HUGE improvement on the Jun-17 version I was using where you had to find out for yourself, and it could take hours/days to locate issues esp if your report had a lot of objects in.