Unlock a world of possibilities! Login now and discover the exclusive benefits awaiting you.
- Qlik Community
- :
- Forums
- :
- Analytics
- :
- New to Qlik Analytics
- :
- Re: Build pivot table problem
- Subscribe to RSS Feed
- Mark Topic as New
- Mark Topic as Read
- Float this Topic for Current User
- Bookmark
- Subscribe
- Mute
- Printer Friendly Page
- Mark as New
- Bookmark
- Subscribe
- Mute
- Subscribe to RSS Feed
- Permalink
- Report Inappropriate Content
Build pivot table problem
Hi dear all, I am new for the Qlik sense cloud. I am going to use this to analysis my survey data.
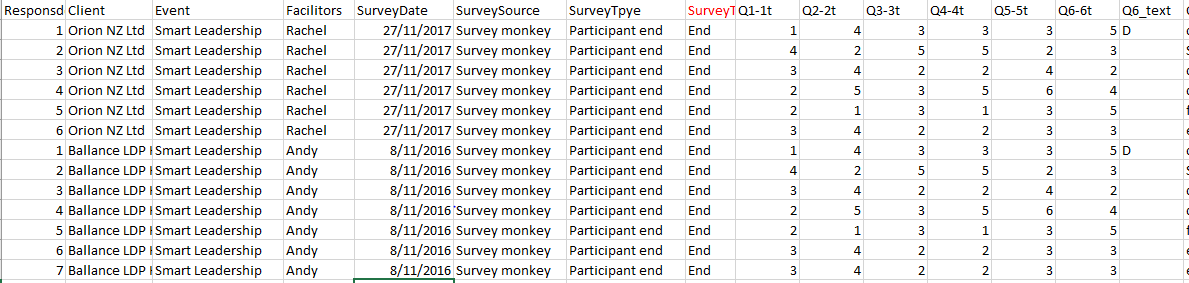
Currently I have one table list below:
So I am going to build a sheet like this:
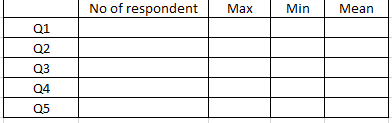
I would like to use 'Client', and 'surveydate' as the dimension, and max field is the max value of Q1-1t, Q2-2t,....... 'No of respondent' is the number of each filed record. Sadly I have no idea how show I start it, anyone give me some suggestions will be really appreciated. Thanks so much!
- Tags:
- data model
- Mark as New
- Bookmark
- Subscribe
- Mute
- Subscribe to RSS Feed
- Permalink
- Report Inappropriate Content
- Mark as New
- Bookmark
- Subscribe
- Mute
- Subscribe to RSS Feed
- Permalink
- Report Inappropriate Content
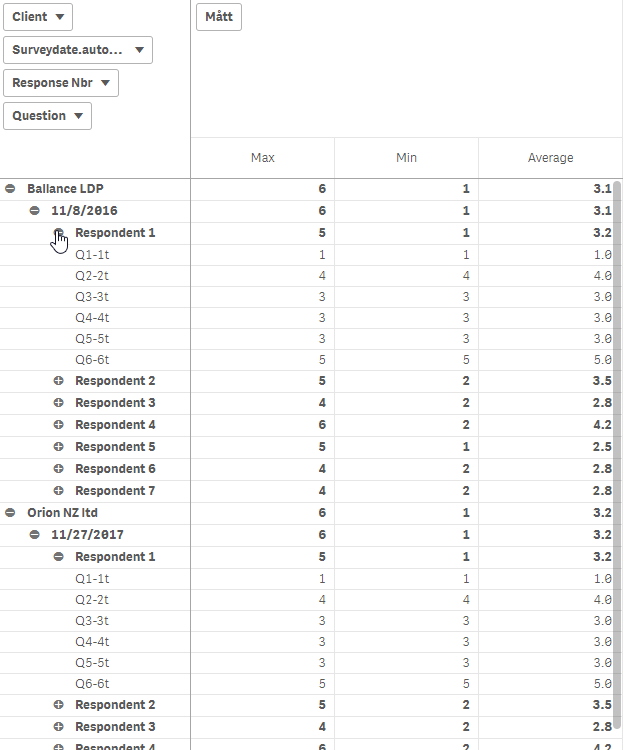
Something like this? Also see attached example app.
- Mark as New
- Bookmark
- Subscribe
- Mute
- Subscribe to RSS Feed
- Permalink
- Report Inappropriate Content
Hi, Lucke, Thanks for your reply. Yes, this is something I would like to use. And the example you listed below, sadly I don't know how to open it. It looks like an Qlik sense file, I am still working on how to open it. But anyway, tks.
- Mark as New
- Bookmark
- Subscribe
- Mute
- Subscribe to RSS Feed
- Permalink
- Report Inappropriate Content
Hi Lucke,
I opened the example and have been tried to build this. I found it seems you create fields called 'question' and 'question.value', how did you create them? Thank you!
- Mark as New
- Bookmark
- Subscribe
- Mute
- Subscribe to RSS Feed
- Permalink
- Report Inappropriate Content
I used the unpivot function in Data Manager to take the Q* fields and place them into 2 fields, question and question.value.
Unpivoting crosstab data in the data manager ‒ Qlik Sense
Unpivoting crosstab data in data manager ‒ Qlik Sense
Regards
Lucke