Unlock a world of possibilities! Login now and discover the exclusive benefits awaiting you.
- Qlik Community
- :
- Forums
- :
- Analytics
- :
- New to Qlik Analytics
- :
- Building chart with selected year and previous yea...
- Subscribe to RSS Feed
- Mark Topic as New
- Mark Topic as Read
- Float this Topic for Current User
- Bookmark
- Subscribe
- Mute
- Printer Friendly Page
- Mark as New
- Bookmark
- Subscribe
- Mute
- Subscribe to RSS Feed
- Permalink
- Report Inappropriate Content
Building chart with selected year and previous year
Hi People
I have a requirement to compare sales of selected year and previous year.
I have used this expression to show previous year data,
=Sum({$<acc_period_year={"$(=acc_period_year-1)"}>}bill_size)
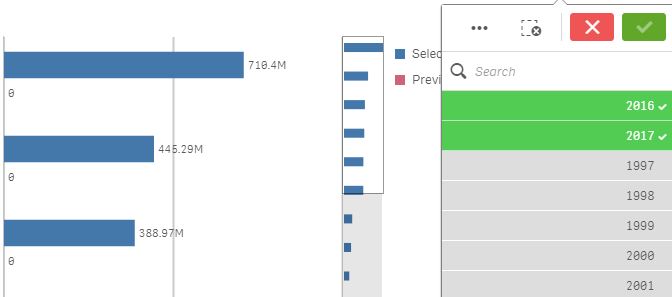
When i select a single year, the chart is displayed.
But when i select 2 years in filter pane, the chart (previous year) is not working.
Please let me know the expression which i could use to display previous year (even when more years are selected).
Thanks
Balaji
- Mark as New
- Bookmark
- Subscribe
- Mute
- Subscribe to RSS Feed
- Permalink
- Report Inappropriate Content
Try this
=Sum({$<acc_period_year={"$(=Max(acc_period_year)-1)"}>}bill_size)
Because when you have selected 2 years, acc_period_year cannot decide which of the two values do we need to use, we add Max() function to pick the bigger of the two years selected
- Mark as New
- Bookmark
- Subscribe
- Mute
- Subscribe to RSS Feed
- Permalink
- Report Inappropriate Content
maybe this:
=Sum({$<acc_period_year={"$(=Min(acc_period_year)-1)"}>}bill_size)
- Mark as New
- Bookmark
- Subscribe
- Mute
- Subscribe to RSS Feed
- Permalink
- Report Inappropriate Content
Thanks for the reply Sunny Talwar.
Your expression considers only max of the selected years and gives values for the previous year.
But i need expression which displays previous year sales of all the selected years.
example
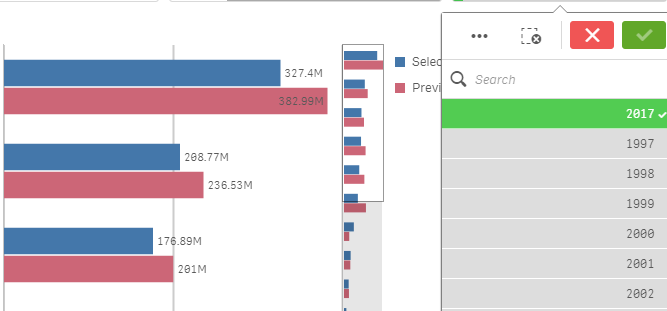
if i select 2017 & 2015 in filter pane.
I should get sales value of year 2016 & 2014 in the previous year chart.
- Mark as New
- Bookmark
- Subscribe
- Mute
- Subscribe to RSS Feed
- Permalink
- Report Inappropriate Content
Thanks for the reply Andrea Gigliotti.
Your expression considers only min of the selected years and gives values for the previous year.
But i need expression which displays previous year sales of all the selected years.
example
if i select 2017 & 2015 in filter pane.
I should get sales value of year 2016 & 2014 in the previous year chart.
- Mark as New
- Bookmark
- Subscribe
- Mute
- Subscribe to RSS Feed
- Permalink
- Report Inappropriate Content
Hello,
"But i need expression which displays previous year sales of all the selected years."
I have the very same need.
Does anyone have a solution?
Thanks!
- Mark as New
- Bookmark
- Subscribe
- Mute
- Subscribe to RSS Feed
- Permalink
- Report Inappropriate Content
similar quest here guys! any guru to help us. pllllsss ![]()
- Mark as New
- Bookmark
- Subscribe
- Mute
- Subscribe to RSS Feed
- Permalink
- Report Inappropriate Content
Hello,
I found a solution for my problem.
In my case, I had to show "Sales amount of current year" and "Sales amount of previous year" in 2 different columns, that repeat themselves the number of years I selected.
I had to use aggregates.
Sales for current year is: sum(Sales)
Sales for previous year should be: aggr(above(sum(Sales)), Year)
You might not have the same problem as I had, but I have to clarify that my table uses many dimensions, used hierarchically:
Salesperson, ItemCategory1, ItemCategory2, ItemCategory3, ItemCategory4 and Year.
So my "Sales for previous year" had to be a bit more complex:
if(dimensionality() = 0, aggr(above(sum(Sales)), Année),
if(dimensionality() = 1, aggr(above(sum(Sales)), Ventes.DLG, Year),
if(dimensionality() = 2, aggr(above(sum(Sales)), Ventes.DLG, ItemCategory1, Year),
if(dimensionality() = 3, aggr(above(sum(Sales)), Ventes.DLG, ItemCategory1, ItemCategory2, Year),
if(dimensionality() = 4, aggr(above(sum(Sales)), Ventes.DLG, ItemCategory1, ItemCategory2, ItemCategory3, Year),
if(dimensionality() = 5, aggr(above(sum(Sales)), Ventes.DLG, ItemCategory1, ItemCategory2, ItemCategory3, ItemCategory4, Year)
))))))
Hope it helps!