Unlock a world of possibilities! Login now and discover the exclusive benefits awaiting you.
- Qlik Community
- :
- Forums
- :
- Analytics
- :
- New to Qlik Analytics
- :
- Calculate average in chart while ignoring date sel...
- Subscribe to RSS Feed
- Mark Topic as New
- Mark Topic as Read
- Float this Topic for Current User
- Bookmark
- Subscribe
- Mute
- Printer Friendly Page
- Mark as New
- Bookmark
- Subscribe
- Mute
- Subscribe to RSS Feed
- Permalink
- Report Inappropriate Content
Calculate average in chart while ignoring date selection
Hey everyone,
Currently I've been stuck with this problem for a while.
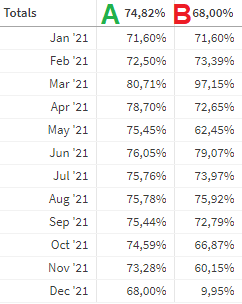
I have a table that shows averages per month (column B). But in column A, I want to show a rolling average of the past 12 months of the data of column B. However, if the user makes a date selection, it only calculates the rolling average in the chart. There is a lot of data in column B of previous years, that I would like it to take into account.
As you can see above, for the first row (Jan '21) it averages not over the 12 months before that, but only over that same month. And for the second row (Feb '21) it averages only over the same and past month, instead of 12 months.
The measure I made for column A is as follows:
rangeavg( above( aggr( (sum(Profit)) / (sum(Revenue)), [Year-Month]), 0, 12))
The date fields that I have are, Month, Year, [Year-Month] and quarter.
I hope this was a clear explanation. I hope it's not too stupid of a question, but currently I've been stuck for too long at this problem, that I cannot see a clear solution anymore.
Thanks!
- Mark as New
- Bookmark
- Subscribe
- Mute
- Subscribe to RSS Feed
- Permalink
- Report Inappropriate Content
Hi,
Could you share some data maybe?
Conceptually, your solution is accomplished with set analysis. You should overrule the range that is needed for your average.
Jordy
Climber
- Mark as New
- Bookmark
- Subscribe
- Mute
- Subscribe to RSS Feed
- Permalink
- Report Inappropriate Content
Hey! Thank you very much for responding.
Of course! I am willing to share data, however the datamodel that this report is built on, is enormous. The datamodel is written in a separate Qlik Sense report for optimization purposes. Is there any specific data you'd need?
Currently I've tried several different solutions with set analysis, such as:
rangeavg({<[Year]=>} above( aggr( (sum({<[Year]=>}Profit)) / (sum({<[Year]=>}Revenue)), [Year-Month]), 0, 12)), or
rangeavg({<[Year]=>} above( aggr( (sum(Profit)) / (sum(Revenue)), [Year-Month]), 0, 12)), or
rangeavg( above( aggr( (sum({<[Year]=>}Profit)) / (sum({<[Year]=>}Revenue)), [Year-Month]), 0, 12))
I've also tried making the "aggr( (sum({<[Year]=>}Profit)) / (sum({<[Year]=>}Revenue)), [Year-Month])" part of the calculation into a specific column and then referencing the column in a calculation, such as:
rangeavg( above( [Margin], 0, 12)), or
rangeavg({<[Year]=>}above( [Margin], 0, 12)), or
rangeavg( above({<[Year]=>} [Margin], 0, 12)), or
However anytime I add the {<[Year]=>} part of the calculation, it just shows nothing in the entire column. It's all greyed out and only - shows, instead of the result of the calculation.
It seems that whenever a selection is made, it will only take into account the data shown in the chart. Most of the time users make selections based on full years.
Thanks for your time!
