Unlock a world of possibilities! Login now and discover the exclusive benefits awaiting you.
- Qlik Community
- :
- Forums
- :
- Analytics
- :
- New to Qlik Analytics
- :
- Calculated row / column
- Subscribe to RSS Feed
- Mark Topic as New
- Mark Topic as Read
- Float this Topic for Current User
- Bookmark
- Subscribe
- Mute
- Printer Friendly Page
- Mark as New
- Bookmark
- Subscribe
- Mute
- Subscribe to RSS Feed
- Permalink
- Report Inappropriate Content
Calculated row / column
Hi,
Is QlikSense able to do the following below? Or it can only be achieved by NPrinting?
Offers Acceptance
2016 2017 2018 Total Offered 2016 2017 2018 Total Accepted
Prog A 2 3 4 | 9 1 2 3 | 6
Prog B 4 5 6 | 15 7 8 9 | 24
----------------------------------------------------------------------------------------------------------------------------------------------
Grand Total: 6 8 10 24 8 10 12 30
Thank you.
- Mark as New
- Bookmark
- Subscribe
- Mute
- Subscribe to RSS Feed
- Permalink
- Report Inappropriate Content
Hi,
Can we see your sourse data?
Regards,
Andrey
- Mark as New
- Bookmark
- Subscribe
- Mute
- Subscribe to RSS Feed
- Permalink
- Report Inappropriate Content
Hi Andrey,
I do not have access to the source data as this is taken care by my another group of colleagues as they are in the midst of transiting from old system to new system. The data will be stored in MS SQL server though.
This is the format that my users are currently using in Excel.
Regards
- Mark as New
- Bookmark
- Subscribe
- Mute
- Subscribe to RSS Feed
- Permalink
- Report Inappropriate Content
Hi,
This looks like a standard Pivot table to me. Quite possible to do right out of the box I think.
Something like this one -
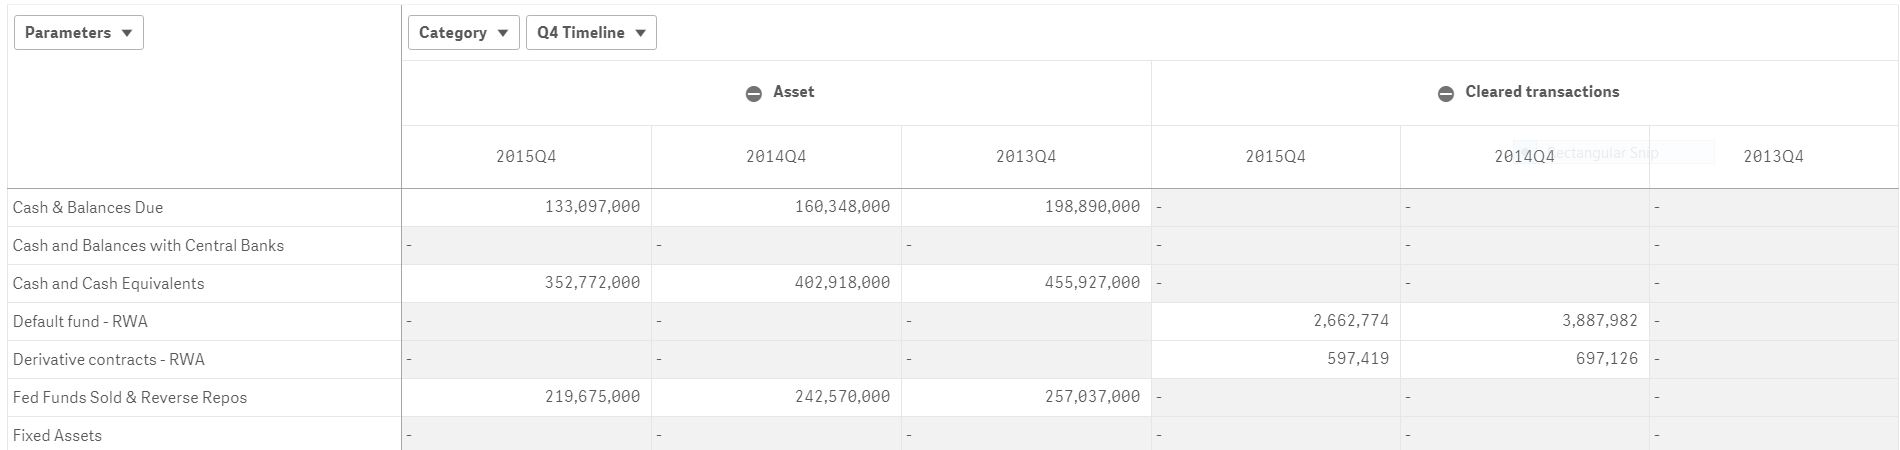
Hope this helps. Let us know if you are not able to get it working.
Thanks,
Ajit
- Mark as New
- Bookmark
- Subscribe
- Mute
- Subscribe to RSS Feed
- Permalink
- Report Inappropriate Content
Hi,
What I am trying to achieve is getting the sum of rows and columns to appear at the side and bottom. From your screenshot, it doesn't show this way.
Right now I do not have the data to try. I would like to know if Qliksense is able to achieve it.
Regards
- Mark as New
- Bookmark
- Subscribe
- Mute
- Subscribe to RSS Feed
- Permalink
- Report Inappropriate Content
Hi,
Sum of rows or columns is quite possible as that is a standard feature as well. I deliberately excluded that since in my data it does not make sense to sum it up. Showing here only for your reference that it can be done in Qlik Sense.
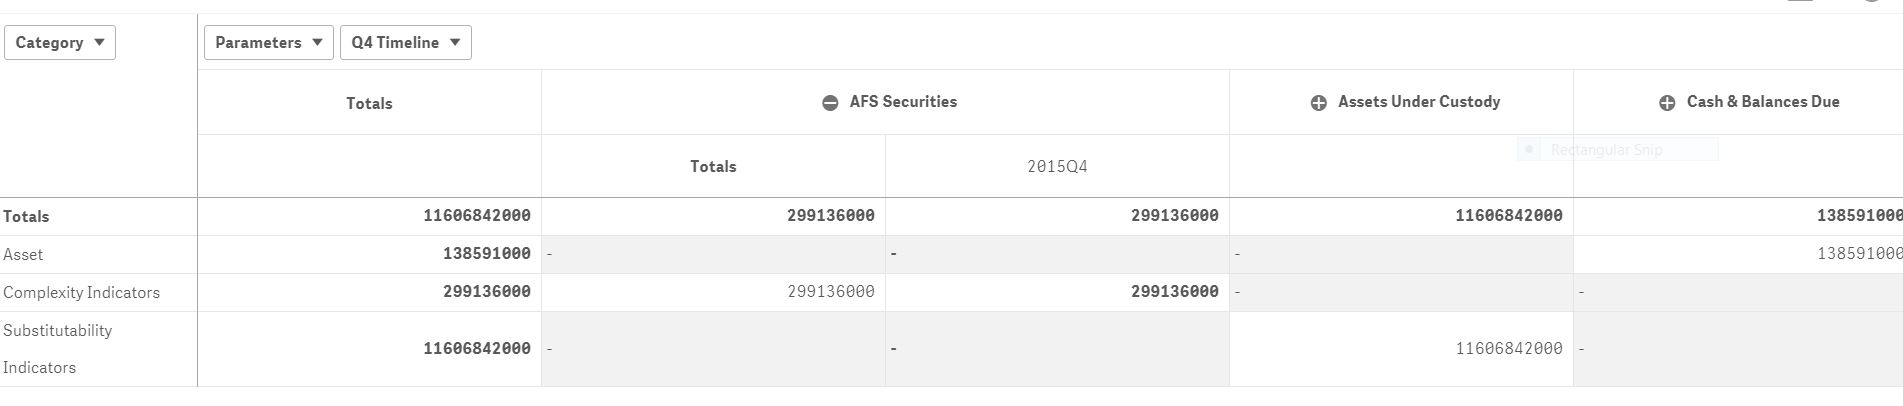
If you can share any sample data and your chart's details, I can provide more specifications on how to get it done.
Hope this helps.
Thanks,
Ajit
- Mark as New
- Bookmark
- Subscribe
- Mute
- Subscribe to RSS Feed
- Permalink
- Report Inappropriate Content
please post some sample data so people here can help you better
If a post helps to resolve your issue, please accept it as a Solution.