Unlock a world of possibilities! Login now and discover the exclusive benefits awaiting you.
- Qlik Community
- :
- Forums
- :
- Analytics
- :
- New to Qlik Analytics
- :
- Re: Calculating Cumulative Percentage of Total by ...
- Subscribe to RSS Feed
- Mark Topic as New
- Mark Topic as Read
- Float this Topic for Current User
- Bookmark
- Subscribe
- Mute
- Printer Friendly Page
- Mark as New
- Bookmark
- Subscribe
- Mute
- Subscribe to RSS Feed
- Permalink
- Report Inappropriate Content
Calculating Cumulative Percentage of Total by Column (Pivot Table)
Dear Qlik Sense Experts,
and I are trying to figure out how to calculate a cumulative percentage of the Total by Column in a Pivot Table in Qlik Sense.
We have a pivot table in Qlik Sense that shows the cumulative count of flags by week for the dimension. We would like to calculate the % of each flag that compares the cumulative count of flags by week over the total cumulative count of all flags of that week.
We're using a unique key = ID to calculate the cumulative count of flags (Flag) by week with certain criteria filters. Expression as below:
RangeSum(Before(Count({[Criteria]}>}[ID]),0,ColumnNo()))
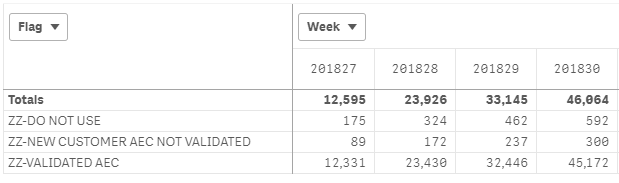
The below is roughly what we're trying to achieve. The cumulative count of each flag should be divided by the Total by Column as of each week but we're having a hard time trying to come up with an expression that does that.
| Flag | 201827 | % | 201828 | % |
|---|---|---|---|---|
| TOTALS | 12,595 | 100% | 23,926 | 100% |
| ZZ-DO NOT USE | 175 | 1.39% | 324 | 1.35% |
| ZZ-NEW CUSTOMER AEC NOT VALIDATED | 89 | 0.71% | 172 | 0.72% |
| ZZ-VALIDATED AEC | 12,331 | 97.9% | 23,430 | 97.93% |
Thank you.
Accepted Solutions
- Mark as New
- Bookmark
- Subscribe
- Mute
- Subscribe to RSS Feed
- Permalink
- Report Inappropriate Content
How about this
RangeSum(Before(Count({<[Criteria]>}[ID]), 0, ColumnNo()))/
Sum(TOTAL <WeekYearField> Aggr(RangeSum(Above(Count({<[Criteria]>} [ID]), 0, RowNo())), Flag, (WeekYearField, (NUMERIC))))
- Mark as New
- Bookmark
- Subscribe
- Mute
- Subscribe to RSS Feed
- Permalink
- Report Inappropriate Content
Thank you very much, Sunny!
- Mark as New
- Bookmark
- Subscribe
- Mute
- Subscribe to RSS Feed
- Permalink
- Report Inappropriate Content
Hi Sunny,
Sorry, but I have a few more questions.
What if I have another dimension "Flag Corrected" and I only want to show those Flag Corrected = Y in the Pivot Table? Is it possible to do so in the pivot table? I've tried to do Qlik Expression under row: =if(Flag Corrected = {"Y"}, Flag Corrected) but it doesn't seem to work.
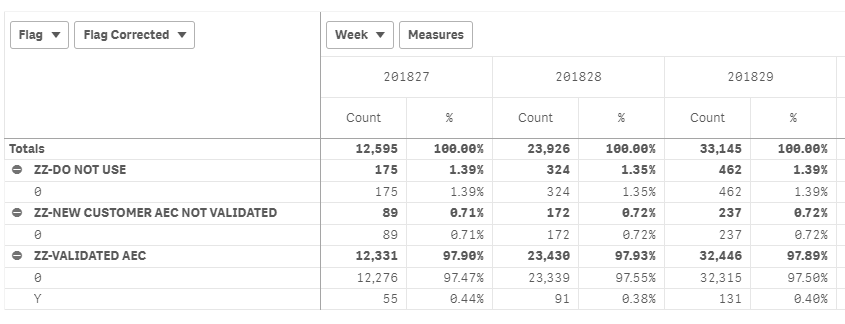
I also would like to calculate the cumulative percentage of Flag Corrected = Y over the total cumulative count of ZZ-VALIDATED AEC flag. For example in Week 201827, the % for Flag Correct = Y should be 55/12,331 = 0.446% instead of 55/12,595=0.436%. Do you think it is possible to do so in a pivot table?
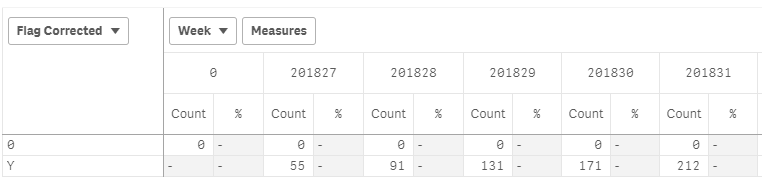
I've tried to create another pivot table to only show the Flag Corrected but am unable to get the cumulative percentage of Flag Corrected = Y over the total cumulative count of ZZ-VALIDATED AEC flag.
I'm using this expression:
RangeSum(Before(Count({<[Criteria]>}ID),0,ColumnNo()))/
Sum(TOTAL <WEEK> Aggr(RangeSum(Before(Count({<[Criteria with Flag = ZZ-VALIDATED AEC]>}ID),
0, ColumnNo())), Flag,(WEEK, (NumericCount))))
- Mark as New
- Bookmark
- Subscribe
- Mute
- Subscribe to RSS Feed
- Permalink
- Report Inappropriate Content
May be this for showing just Flag Corrected = 'Y'
RangeSum(Before(Count({<[Criteria], [Flag Corrected] = {'Y'}>}[ID]), 0, ColumnNo()))/
Sum(TOTAL <WeekYearField> Aggr(RangeSum(Above(Count({<[Criteria], [Flag Corrected] = {'Y'}>} [ID]), 0, RowNo())), Flag, (WeekYearField, (NUMERIC))))
- Mark as New
- Bookmark
- Subscribe
- Mute
- Subscribe to RSS Feed
- Permalink
- Report Inappropriate Content
I also would like to calculate the cumulative percentage of Flag Corrected = Y over the total cumulative count of ZZ-VALIDATED AEC flag. For example in Week 201827, the % for Flag Correct = Y should be 55/12,331 = 0.446% instead of 55/12,595=0.436%. Do you think it is possible to do so in a pivot table?
May be this
RangeSum(Before(Count({<[Criteria]>}[ID]), 0, ColumnNo()))/
Sum(TOTAL <WeekYearField, Flag> Aggr(RangeSum(Above(Count({<[Criteria]>} [ID]), 0, RowNo())), Flag, [Flag Corrected],(WeekYearField, (NUMERIC))))
- Mark as New
- Bookmark
- Subscribe
- Mute
- Subscribe to RSS Feed
- Permalink
- Report Inappropriate Content
Is there a third question?