Unlock a world of possibilities! Login now and discover the exclusive benefits awaiting you.
- Qlik Community
- :
- Forums
- :
- Analytics
- :
- New to Qlik Analytics
- :
- Calculating YTD from Monthly data where month is s...
- Subscribe to RSS Feed
- Mark Topic as New
- Mark Topic as Read
- Float this Topic for Current User
- Bookmark
- Subscribe
- Mute
- Printer Friendly Page
- Mark as New
- Bookmark
- Subscribe
- Mute
- Subscribe to RSS Feed
- Permalink
- Report Inappropriate Content
Calculating YTD from Monthly data where month is sorted from July to June
Hello,
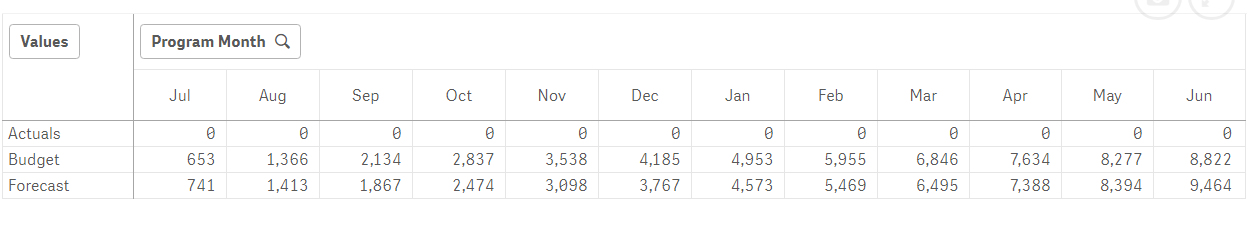
I want to convert the attached pivot (monthly) data to show in YTD format. Program months column is sorted from July to June and is filtered to show only one financial year in the graph. Any help will be appreciated.
Expression for sorting the data: - match([Program Month],'Jul','Aug','Sep','Oct','Nov','Dec','Jan','Feb','Mar','Apr','May','Jun')
Expression for getting the monthly Actuals: - Sum([Actual Volume])
I am using below expression to calculate the YTD in the graph and is giving me the expected result. Unfortunately the same is not working for pivot.
RangeSum(Above(Sum([Actual Volume]), 0, RowNo()))
Thanks
- Tags:
- aggr()
Accepted Solutions
- Mark as New
- Bookmark
- Subscribe
- Mute
- Subscribe to RSS Feed
- Permalink
- Report Inappropriate Content
A colleague suggested to use ColumnNo() instead of RowNo() and it worked.
RangeSum(before(Sum([Actual Volume]), 0, ColumnNo()))
Thanks
- Mark as New
- Bookmark
- Subscribe
- Mute
- Subscribe to RSS Feed
- Permalink
- Report Inappropriate Content
RangeSum(Before(Sum([Actual Volume]), 0, RowNo()))
try
- Mark as New
- Bookmark
- Subscribe
- Mute
- Subscribe to RSS Feed
- Permalink
- Report Inappropriate Content
Thanks.
Still returning 0 for all the months.

- Mark as New
- Bookmark
- Subscribe
- Mute
- Subscribe to RSS Feed
- Permalink
- Report Inappropriate Content
sum(aggr(RangeSum(above(Sum([Actual Volume]), 0, RowNo())),Programmonth,values))
- Mark as New
- Bookmark
- Subscribe
- Mute
- Subscribe to RSS Feed
- Permalink
- Report Inappropriate Content
Appreciate your help.
Logically, the formula you have provided should work but somehow I am still getting 0s.
sum(aggr(RangeSum(above(Sum([Actual Volume]), 0, RowNo())),[Program Month],
'Jul','Aug','Sep','Oct','Nov','Dec','Jan','Feb','Mar','Apr','May','Jun'))
Regards,
Abhi
- Mark as New
- Bookmark
- Subscribe
- Mute
- Subscribe to RSS Feed
- Permalink
- Report Inappropriate Content
A colleague suggested to use ColumnNo() instead of RowNo() and it worked.
RangeSum(before(Sum([Actual Volume]), 0, ColumnNo()))
Thanks
- Mark as New
- Bookmark
- Subscribe
- Mute
- Subscribe to RSS Feed
- Permalink
- Report Inappropriate Content