Unlock a world of possibilities! Login now and discover the exclusive benefits awaiting you.
- Qlik Community
- :
- Forums
- :
- Analytics
- :
- New to Qlik Analytics
- :
- Can Qliksense visualize a warehouse heatmap
- Subscribe to RSS Feed
- Mark Topic as New
- Mark Topic as Read
- Float this Topic for Current User
- Bookmark
- Subscribe
- Mute
- Printer Friendly Page
- Mark as New
- Bookmark
- Subscribe
- Mute
- Subscribe to RSS Feed
- Permalink
- Report Inappropriate Content
Can Qliksense visualize a warehouse heatmap
Hi all,
Previously, I did the warehouse heat map on Excel. The steps are follow:
1. Draw the warehouse layout on the spreadsheet and give an value to each cell which represent a warehouse location
2. Analyze the inventory moving frequency(of a particular location) and rank the frequency.
3. Use warehouse location to look up the ranking value.
So my question is: can I create a layout and heat map on Qliksense/how can we import the layout, if possible?
Br,
Oli
- Tags:
- heatmap
- Mark as New
- Bookmark
- Subscribe
- Mute
- Subscribe to RSS Feed
- Permalink
- Report Inappropriate Content
You could create an svg file out of the floorplan and use svgReader extension to visualize the floorplan:
- Mark as New
- Bookmark
- Subscribe
- Mute
- Subscribe to RSS Feed
- Permalink
- Report Inappropriate Content
Hi Markus,
Thanks for bringing this idea. It is very nice.
I am evaluating the feasibility. Do you know what are the major limitation? As you know, I have many many cells on a floorplan and every warehouse layout is very irregular and has to be tailor made.
Br,
Oliver
- Mark as New
- Bookmark
- Subscribe
- Mute
- Subscribe to RSS Feed
- Permalink
- Report Inappropriate Content
It will probably be quite a lot of manual work with svg editor. Depends probably on the use case and business benefits if it is worth the time and effort.
- Mark as New
- Bookmark
- Subscribe
- Mute
- Subscribe to RSS Feed
- Permalink
- Report Inappropriate Content
Thanks Markus!
- Mark as New
- Bookmark
- Subscribe
- Mute
- Subscribe to RSS Feed
- Permalink
- Report Inappropriate Content
hello
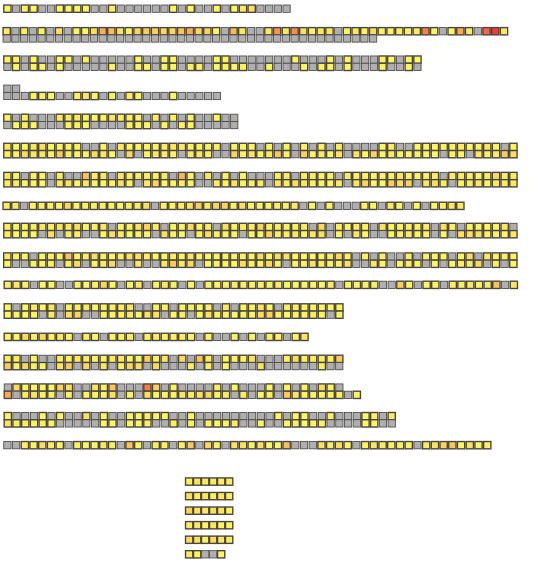
I tried the svg editor extension but couldn't succeed. The coloring of boxes is not possible i guess. so i tried the pivot table according to suggestions from the forum. You can find the link of my topic here Warehouse layout with qlik sense
the shelfs currently look like below.
- Mark as New
- Bookmark
- Subscribe
- Mute
- Subscribe to RSS Feed
- Permalink
- Report Inappropriate Content
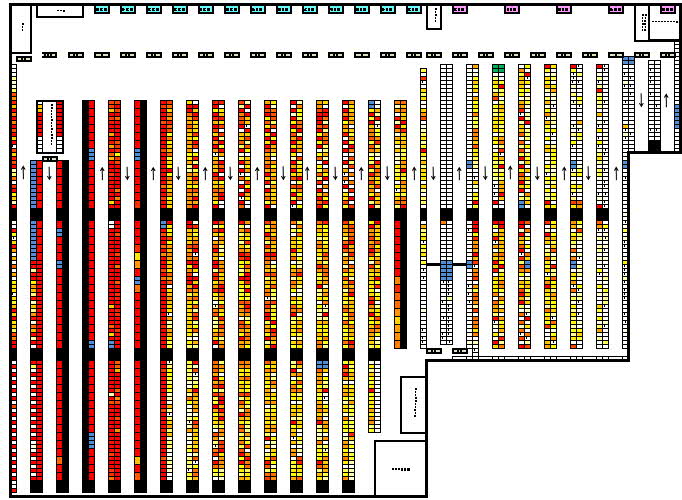
Hi,
I've been playing around with SVG reader extenstion and Inkscape and I have created a first ruff draft of our warehouse pick locations. I've created some vba in excel to speed upp the process of creating the shelfs and the id's of them and exporting the code to the svg file I use. It's a very easy process most of the time will be in creating the design of the warehouse and Inkscape is a good tool for that. I will also try using the pivot table proposal to show the shelf and the picks from the y axis.