Unlock a world of possibilities! Login now and discover the exclusive benefits awaiting you.
- Qlik Community
- :
- Forums
- :
- Analytics
- :
- New to Qlik Analytics
- :
- Re: Changing color by measure
- Subscribe to RSS Feed
- Mark Topic as New
- Mark Topic as Read
- Float this Topic for Current User
- Bookmark
- Subscribe
- Mute
- Printer Friendly Page
- Mark as New
- Bookmark
- Subscribe
- Mute
- Subscribe to RSS Feed
- Permalink
- Report Inappropriate Content
Changing color by measure
Hi all, I have a problem where I want to change the color of the measures separately. Please see the chart below. I want to set all triangles as red if they are above the horizontal line and green if they are below the horizontal line. I want the color of the horizontal line to be red. Right now the line is green. My color expression is the following:
if(triangle>UpperLimit,red(),green())
You can see that the one red triangle below. The corresponding segment of the horizontal line is also red. How can I express the color so that the entire horizontal line is red, and that all triangles above the line is red and all triangles below it is green?
Thanks.

- « Previous Replies
-
- 1
- 2
- Next Replies »
Accepted Solutions
- Mark as New
- Bookmark
- Subscribe
- Mute
- Subscribe to RSS Feed
- Permalink
- Report Inappropriate Content
Hi Allen,
It's currently not possible to format color per measure, instead as you noticed the will share the same color.
It's an improvement we're looking at.
Best regards,
Patrik
- Mark as New
- Bookmark
- Subscribe
- Mute
- Subscribe to RSS Feed
- Permalink
- Report Inappropriate Content
Background color of upperlimit as Red()
- Mark as New
- Bookmark
- Subscribe
- Mute
- Subscribe to RSS Feed
- Permalink
- Report Inappropriate Content
Where would I set background color? Can you elaborate on your suggestion?
- Mark as New
- Bookmark
- Subscribe
- Mute
- Subscribe to RSS Feed
- Permalink
- Report Inappropriate Content
Hi Allen, let me see if this is possible.
Hello plu - is this possible?
Please mark the appropriate replies as CORRECT / HELPFUL so our team and other members know that your question(s) has been answered to your satisfaction.
Regards,
Mike Tarallo
Qlik
Mike Tarallo
Qlik
- Mark as New
- Bookmark
- Subscribe
- Mute
- Subscribe to RSS Feed
- Permalink
- Report Inappropriate Content
Hi Allen,
It's currently not possible to format color per measure, instead as you noticed the will share the same color.
It's an improvement we're looking at.
Best regards,
Patrik
- Mark as New
- Bookmark
- Subscribe
- Mute
- Subscribe to RSS Feed
- Permalink
- Report Inappropriate Content
Thanks for the response Patrick. Maybe also allow reference lines on Combo charts! This way I can just pick the color of the reference line instead of specifying a measure as the horizontal line.
- Mark as New
- Bookmark
- Subscribe
- Mute
- Subscribe to RSS Feed
- Permalink
- Report Inappropriate Content
Yes, it's also an improvement we have. The difference here compared to other charts is that if you use one axis on each side it will be a bit trickier to draw the reference line without interrupting the axis values.
For this scenario, would not a bar chart work together with a reference line? You could color the bars depending on if they are above or below the reference line (which you could control the color of). Or is it a requirement that glyphs are used to represent the data?
Best regards,
Patrik
- Mark as New
- Bookmark
- Subscribe
- Mute
- Subscribe to RSS Feed
- Permalink
- Report Inappropriate Content
Please do not use color expressions as that would not give you the desired result. Please test with the following steps:
1. Create a reference line in your chart from the 'Presentation' tab decide the line weight, color and style
2. Input the reference line expression as the desired value where you want the ref line to show
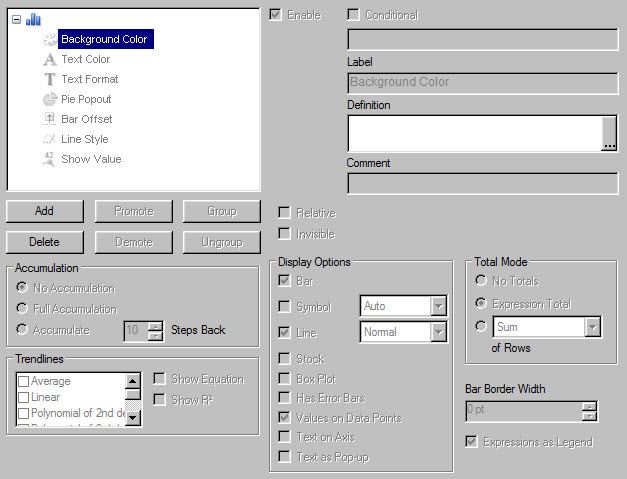
3. In the expression on the left menu select Background Color and in the 'Definition' input the following:
If( triangle> [Reference Line Expression] ,red(),green())
This should give you the desired results.
- Mark as New
- Bookmark
- Subscribe
- Mute
- Subscribe to RSS Feed
- Permalink
- Report Inappropriate Content
It would be nice then to have the ability to specify which axis to anchor the reference line. But yeah I agree this will be pretty tricky to accomplish. I will leave the experts to that!
I have the bar chart with reference line  I am just trying different visuals. Thanks Patrik.
- Mark as New
- Bookmark
- Subscribe
- Mute
- Subscribe to RSS Feed
- Permalink
- Report Inappropriate Content
Allen,
We had a similar issue as yours and were able to get around it with the steps that I have suggested above.
Regards
SNC
- « Previous Replies
-
- 1
- 2
- Next Replies »