Unlock a world of possibilities! Login now and discover the exclusive benefits awaiting you.
- Qlik Community
- :
- Forums
- :
- Analytics
- :
- New to Qlik Analytics
- :
- Re: Chart with three columns
- Subscribe to RSS Feed
- Mark Topic as New
- Mark Topic as Read
- Float this Topic for Current User
- Bookmark
- Subscribe
- Mute
- Printer Friendly Page
- Mark as New
- Bookmark
- Subscribe
- Mute
- Subscribe to RSS Feed
- Permalink
- Report Inappropriate Content
Chart with three columns
Hi all,
I'm creating a very simple chart, just three columns one after another.
I have the three expressions corresponding to the values I want to represent and if I place them as Measures, it works: they are displayed as three columns.
Count({<StartDate={"=InWeek(StartDate, Today(), 0)"}>}EventCode)
Count({<StartDate={"=InWeek(StartDate, Today(), -1)"}>}EventCode)
Count({<Year={$(=vTodayYear-1)}, Week={$(=vTodayWeek)}>}EventCode)
I'd like to name them Current Week, Last Week, Same Week Last Year. What do I have to create as a Dimension for this?
Thanks!
Juan
Accepted Solutions
- Mark as New
- Bookmark
- Subscribe
- Mute
- Subscribe to RSS Feed
- Permalink
- Report Inappropriate Content
Hi,
Dim:- =ValueList('Current week','Last week','Same Week Last Year')
Expr:-
=if(ValueList('Current week','Last week','Same Week Last Year')='Current week',
Count({<StartDate={"=InWeek(StartDate, Today(), 0)"}>}EventCode),
if(ValueList('Current week','Last week','Same Week Last Year')='Last week',
Count({<StartDate={"=InWeek(StartDate, Today(), -1)"}>}EventCode),
if(ValueList('Current week','Last week','Same Week Last Year')='Same Week Last Year',
Count({<Year={$(=vTodayYear-1)}, Week={$(=vTodayWeek)}>}EventCode))))
Regards,
- Mark as New
- Bookmark
- Subscribe
- Mute
- Subscribe to RSS Feed
- Permalink
- Report Inappropriate Content
Hi Juan,
Bellow the expressions, you have the "Label" box in which you can put your "Current Week", "Last Week" and "Same Week Last Year" text (mine is in portuguese, but it's this field).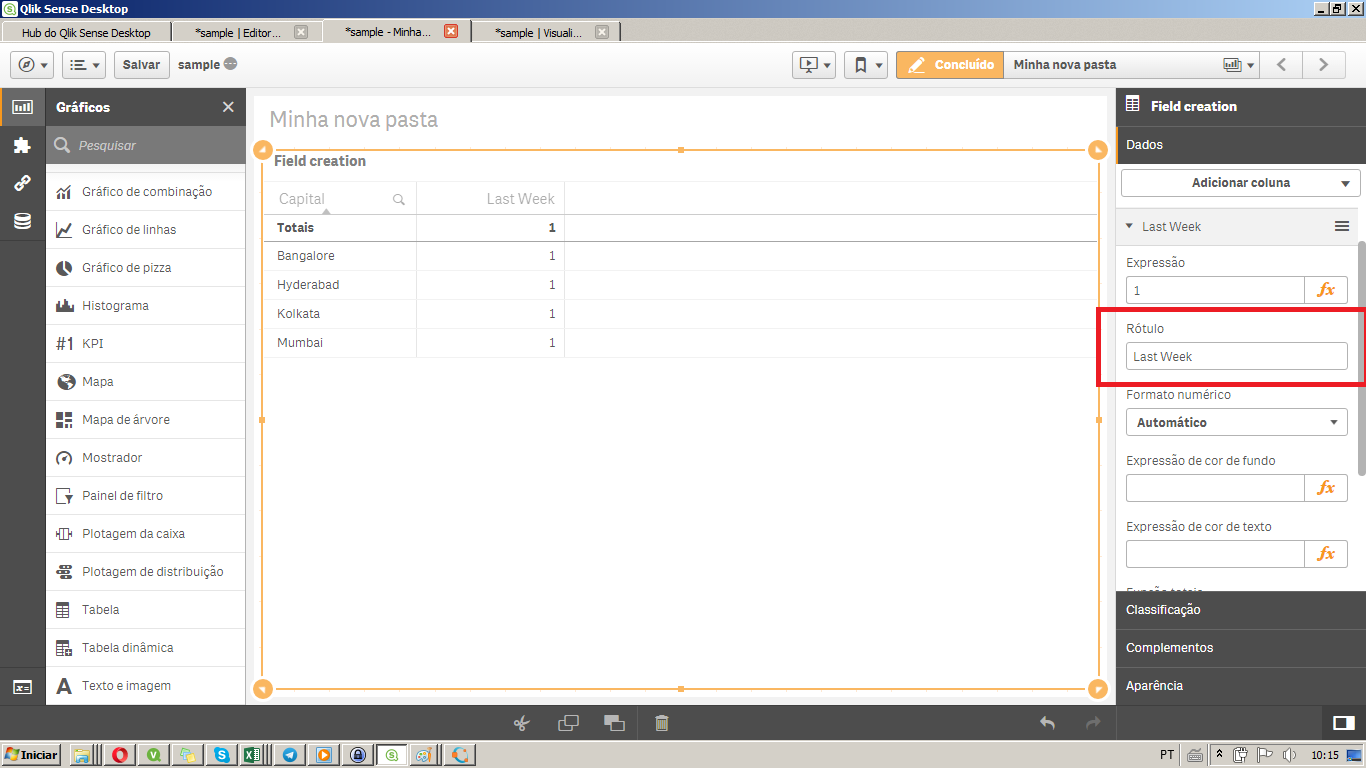
Felipe.
- Mark as New
- Bookmark
- Subscribe
- Mute
- Subscribe to RSS Feed
- Permalink
- Report Inappropriate Content
Hi Felipe, I already did that, but it does not get displayed. Take into account I'm using a bar chart, not a table. That's why I have to define a dimension, but I'm not sure of what to configure there.
- Mark as New
- Bookmark
- Subscribe
- Mute
- Subscribe to RSS Feed
- Permalink
- Report Inappropriate Content
Juan,
They go as axis on the barchart and graph legends as demonstrated bellow.
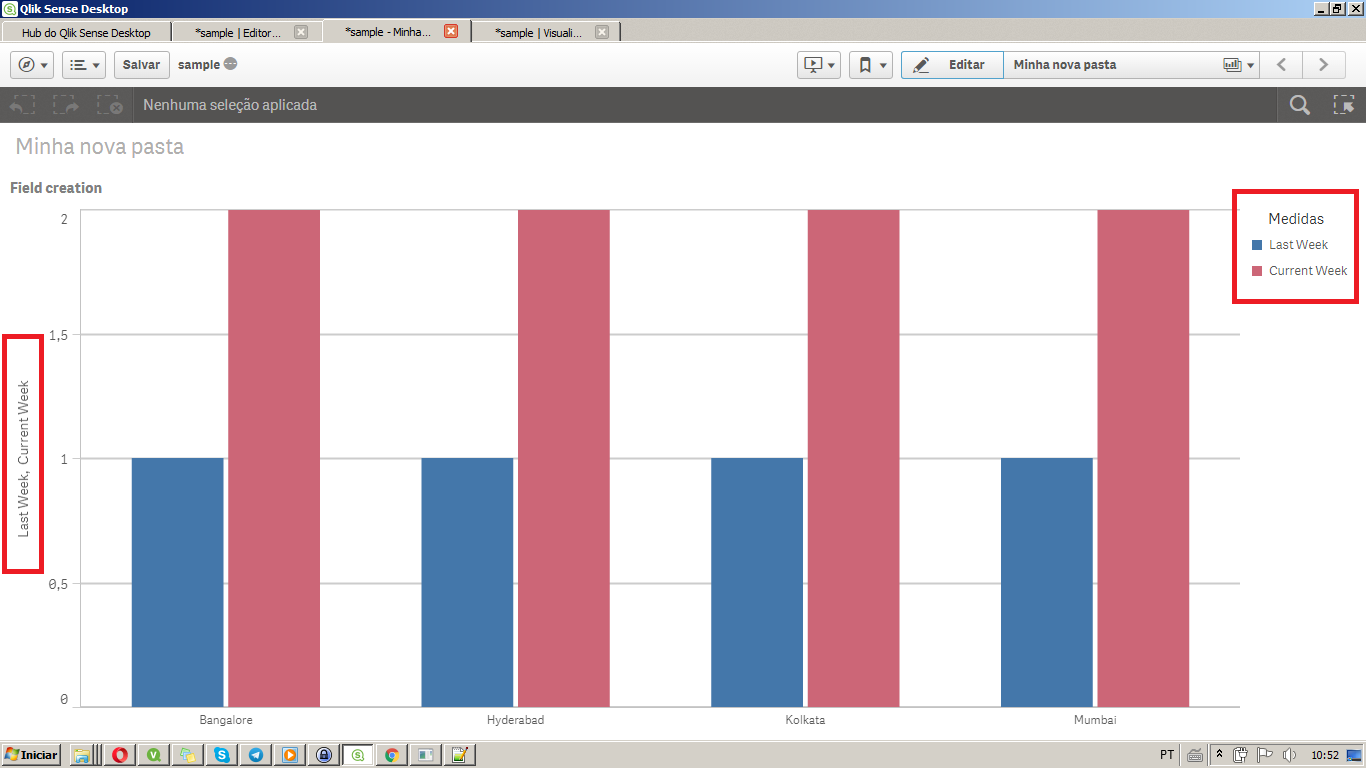
Felipe.
- Mark as New
- Bookmark
- Subscribe
- Mute
- Subscribe to RSS Feed
- Permalink
- Report Inappropriate Content
But Felipe, how did you get "Bangalore, Hyderabad... etc".? Is it related to the dimension you're using? What dimension is it, by the way?
- Mark as New
- Bookmark
- Subscribe
- Mute
- Subscribe to RSS Feed
- Permalink
- Report Inappropriate Content
It's just some sample data, it's a dimension as any other, and can be changed. (I was anwsering another post here and used the same app with this data).
With the following code:
Calendar:
Load
Month(InicialDate) & '-' & Year(InicialDate) as [Year/Month],
InicialDate;
LOAD
date(AddMonths(Today(),-12)+recno()) as InicialDate
AUTOGENERATE Today()-AddMonths(Today(),-12);
I generate all the dates between today and 12 months back (for better example) and put [Year/Month] as the barchart dimension, giving
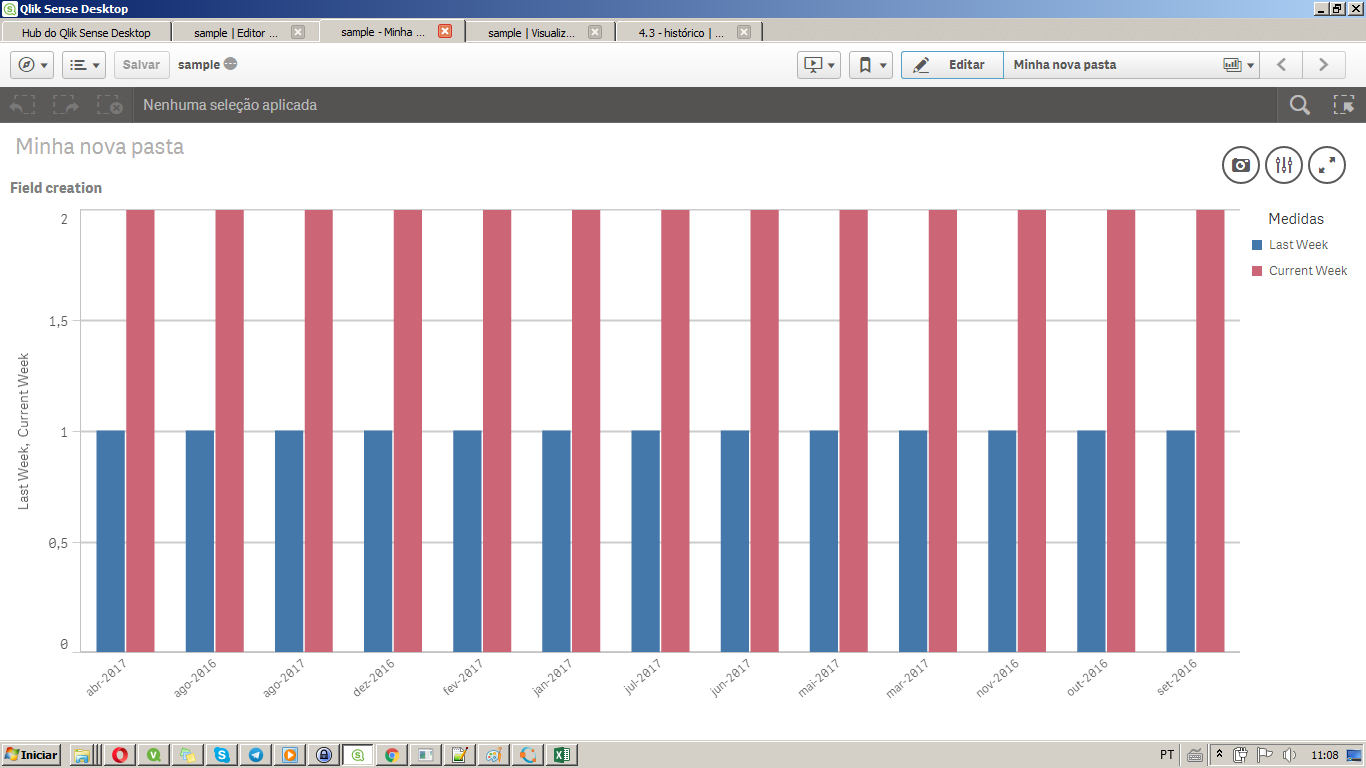
I attached the file I created here, just copy it to C:\Users\<user name>\Documents\Qlik\Sense\Apps and you'll see it in Qlik Sense hub.
- Mark as New
- Bookmark
- Subscribe
- Mute
- Subscribe to RSS Feed
- Permalink
- Report Inappropriate Content
Hi,
You expecting like this,
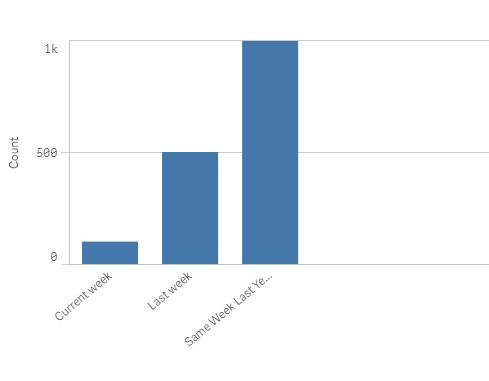
Regards,
- Mark as New
- Bookmark
- Subscribe
- Mute
- Subscribe to RSS Feed
- Permalink
- Report Inappropriate Content
Hi,
That's exactly what I'm trying to get.
Regards.
- Mark as New
- Bookmark
- Subscribe
- Mute
- Subscribe to RSS Feed
- Permalink
- Report Inappropriate Content
Hi,
Dim:- =ValueList('Current week','Last week','Same Week Last Year')
Expr:-
=if(ValueList('Current week','Last week','Same Week Last Year')='Current week',
Count({<StartDate={"=InWeek(StartDate, Today(), 0)"}>}EventCode),
if(ValueList('Current week','Last week','Same Week Last Year')='Last week',
Count({<StartDate={"=InWeek(StartDate, Today(), -1)"}>}EventCode),
if(ValueList('Current week','Last week','Same Week Last Year')='Same Week Last Year',
Count({<Year={$(=vTodayYear-1)}, Week={$(=vTodayWeek)}>}EventCode))))
Regards,
- Mark as New
- Bookmark
- Subscribe
- Mute
- Subscribe to RSS Feed
- Permalink
- Report Inappropriate Content
Works great. Thank you!