Unlock a world of possibilities! Login now and discover the exclusive benefits awaiting you.
- Qlik Community
- :
- Forums
- :
- Analytics
- :
- New to Qlik Analytics
- :
- Class as Dimension in a straight table
- Subscribe to RSS Feed
- Mark Topic as New
- Mark Topic as Read
- Float this Topic for Current User
- Bookmark
- Subscribe
- Mute
- Printer Friendly Page
- Mark as New
- Bookmark
- Subscribe
- Mute
- Subscribe to RSS Feed
- Permalink
- Report Inappropriate Content
Class as Dimension in a straight table
Hi,
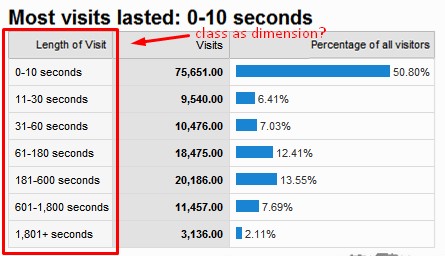
Although it's clear how to build a histogram using the CLASS function, I can't figure it out how to make a dimension using Class function in a straight table.
That's what I have now:
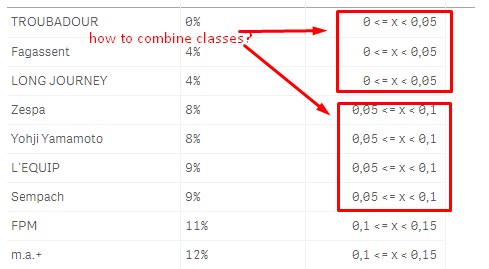
That's what I want to accomplish:
- Tags:
- class()
Accepted Solutions
- Mark as New
- Bookmark
- Subscribe
- Mute
- Subscribe to RSS Feed
- Permalink
- Report Inappropriate Content
I was in process of making a sample app for you when I realized the reason.
Yes, CLASS can be used as Dimension.
My problem was resolved by adding AGGR
=class( aggr ( Sum(Sales), [Customer] ), 0.05)
- Mark as New
- Bookmark
- Subscribe
- Mute
- Subscribe to RSS Feed
- Permalink
- Report Inappropriate Content
Have you seen this:
If you are still not able to figure it out, would you be able to share a sample where we might be able to help you out?
- Mark as New
- Bookmark
- Subscribe
- Mute
- Subscribe to RSS Feed
- Permalink
- Report Inappropriate Content
Yes, I have seen this.
I am able to replicate this on CHART, because CLASS is allowed to be used as DIMENSION on chart.
I am NOT able to replicate it in TABLE, because CLASS is not allowed to be used as DIMENSION in table.
My question is a general one: is it a limitation of QlikSense?
- Mark as New
- Bookmark
- Subscribe
- Mute
- Subscribe to RSS Feed
- Permalink
- Report Inappropriate Content
I have never tried this in Qlik Sense table, but I would not think that it won't work. Can you share a sample where this isn't working?
- Mark as New
- Bookmark
- Subscribe
- Mute
- Subscribe to RSS Feed
- Permalink
- Report Inappropriate Content
I was in process of making a sample app for you when I realized the reason.
Yes, CLASS can be used as Dimension.
My problem was resolved by adding AGGR
=class( aggr ( Sum(Sales), [Customer] ), 0.05)
- Mark as New
- Bookmark
- Subscribe
- Mute
- Subscribe to RSS Feed
- Permalink
- Report Inappropriate Content
Super 