Unlock a world of possibilities! Login now and discover the exclusive benefits awaiting you.
- Qlik Community
- :
- Forums
- :
- Analytics
- :
- New to Qlik Analytics
- :
- Re: Class function
- Subscribe to RSS Feed
- Mark Topic as New
- Mark Topic as Read
- Float this Topic for Current User
- Bookmark
- Subscribe
- Mute
- Printer Friendly Page
- Mark as New
- Bookmark
- Subscribe
- Mute
- Subscribe to RSS Feed
- Permalink
- Report Inappropriate Content
Class function
Hi,
I want to create a dimension using class function like below for a bar chart.
My dimension is Customer Name
and measurement is Gross Profit = sum(revenue)-(sum(cost)+sum(additional services))
My interval will be 10000.
can you please help me with the syntax.
how i can put the calculation for Gross profit inside the expression, to see how many customers fall under 0 to 10000 or 10000 to 20000 gross profit bucket.
thanks
Prasanta
- Tags:
- class function
- Mark as New
- Bookmark
- Subscribe
- Mute
- Subscribe to RSS Feed
- Permalink
- Report Inappropriate Content
I guess something like this:
Dimension:
Class(Aggr((Sum(revenue)-(Sum(cost)+Sum(additional services))), [Customer Name]), 10000)
Expression:
Count(DISTINCT [Customer Name])
- Mark as New
- Bookmark
- Subscribe
- Mute
- Subscribe to RSS Feed
- Permalink
- Report Inappropriate Content
this is not working in my case
- Mark as New
- Bookmark
- Subscribe
- Mute
- Subscribe to RSS Feed
- Permalink
- Report Inappropriate Content
Would you be able to share some sample data?
- Mark as New
- Bookmark
- Subscribe
- Mute
- Subscribe to RSS Feed
- Permalink
- Report Inappropriate Content
Seems to be working for me in the attached sample. Can you check to see if you have the same structure?
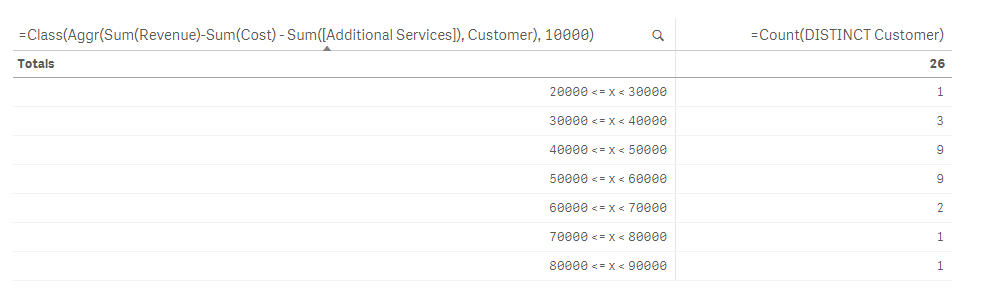
Sample script used:
Table:
LOAD *,
Ceil(Rand() * (50000 - 25000) + 25000) as Revenue,
Ceil(Rand() * (15000 - 10000) + 10000) as Cost,
Ceil(Rand() * (10000 - 5000) + 5000) as [Additional Services]
While IterNo() <= 3;
LOAD * Inline [
Customer
A
B
C
D
E
F
G
H
I
J
K
L
M
N
O
P
Q
R
S
T
U
V
W
X
Y
Z
];
Dimension:
=Class(Aggr(Sum(Revenue)-Sum(Cost) - Sum([Additional Services]), Customer), 10000)
Expression:
Count(DISTINCT Customer)
- Mark as New
- Bookmark
- Subscribe
- Mute
- Subscribe to RSS Feed
- Permalink
- Report Inappropriate Content
| Country | Customers | Revenue | Cost1 | Cost2 | Cost3 |
| Ind | Orang | 100 | 43 | 0 | 7 |
| Rus | Bharti | 2000 | 54 | 545 | 34 |
| Ind | Rel | 100 | 12 | 3 | 4 |
| Rus | HP | 500 | 54 | 11 | 35 |
| America | Orang | 2343 | 454 | 333 | 35 |
| EMEA | Bharti | 3423 | 755 | 534 | 3 |
| Pak | Rel | 645 | 76 | 34 | 4 |
| Bang | HP | 5477 | 343 | 435 | 345 |
| America | Kelvinator | 100 | 45 | 4 | 3 |
| EMEA | wirlpool | 2000 | 687 | 43 | 354 |
| Pak | Orang | 100 | 23 | 3 | 4 |
| Bang | Bharti | 500 | 242 | 32 | 23 |
| EMEA | Rel | 6000 | 464 | 32 | 2 |
I want to create a class for based on Revenue and Profit.
and want to see customers at interval of 100.
1st Bar chart
=====================
My dimension is Customer Name
and measurement for Profit = sum(revenue)-(sum(cost1)+sum(cost2)+sum(cost3))
My interval will be 100.
2nd Bar chart
=======================
Dimension customer name
Measurement - Sum(rev)
Thanks
Prasata
- Mark as New
- Bookmark
- Subscribe
- Mute
- Subscribe to RSS Feed
- Permalink
- Report Inappropriate Content
basically i want to see on bar chart, the customers with Gross profit interval of 0 to 100. 100 to 200 and so on.
Simillary want to see customers on bar chart for based on total revenu with interval from 0 to 100, 100 to 200 and so on.
- Mark as New
- Bookmark
- Subscribe
- Mute
- Subscribe to RSS Feed
- Permalink
- Report Inappropriate Content
Interval will be 100?
What does that even mean? I have no idea how to interpret that. Can you draw a picture by hand to show what is that you are looking for?
- Mark as New
- Bookmark
- Subscribe
- Mute
- Subscribe to RSS Feed
- Permalink
- Report Inappropriate Content
Actually on X axis of bar chart, i want to put the interval like, 0 to 100, 100 to 200, 200 to 300...and so on..
and on Y axis, when i sum up the revenue for a particular customer, i will have the bar under respective interval..
for example, sum of revenue for Orange is 2543, so the bar for orange should be drawn under interval 2500 to 2600.
simillary, i want to calculate the profit and draw the bar for customer under respective intervals.
is it possible?
thanks
- Mark as New
- Bookmark
- Subscribe
- Mute
- Subscribe to RSS Feed
- Permalink
- Report Inappropriate Content
QlikSense isn't working right now, but this should work in Qlik Sense the same way:
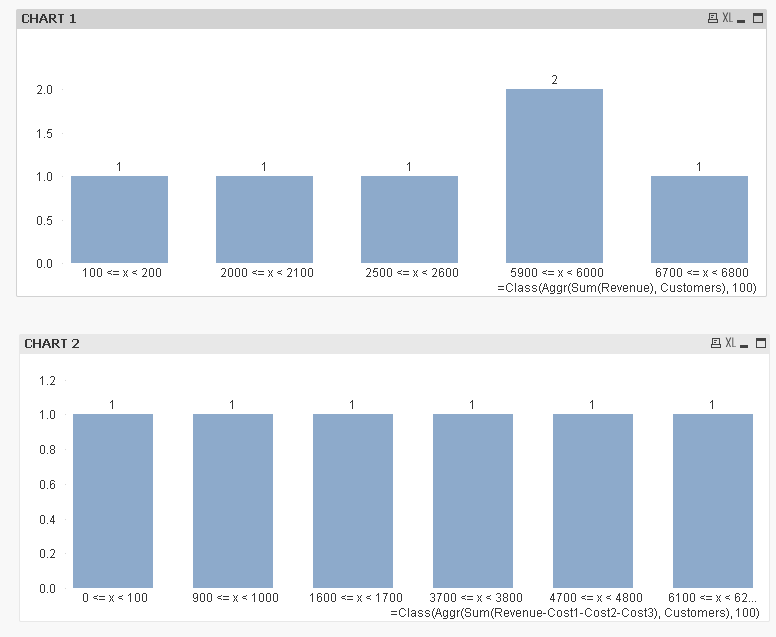
CHART1
Dimension:
=Class(Aggr(Sum(Revenue), Customers), 100)
Expression:
=Count(DISTINCT Customers)
CHART2
Dimension:
=Class(Aggr(Sum(Revenue-Cost1-Cost2-Cost3), Customers), 100)
Expression:
=Count(DISTINCT Customers)