Unlock a world of possibilities! Login now and discover the exclusive benefits awaiting you.
- Qlik Community
- :
- Forums
- :
- Analytics
- :
- New to Qlik Analytics
- :
- Re: Color Expression on stacked bar chart based on...
- Subscribe to RSS Feed
- Mark Topic as New
- Mark Topic as Read
- Float this Topic for Current User
- Bookmark
- Subscribe
- Mute
- Printer Friendly Page
- Mark as New
- Bookmark
- Subscribe
- Mute
- Subscribe to RSS Feed
- Permalink
- Report Inappropriate Content
Color Expression on stacked bar chart based on measure
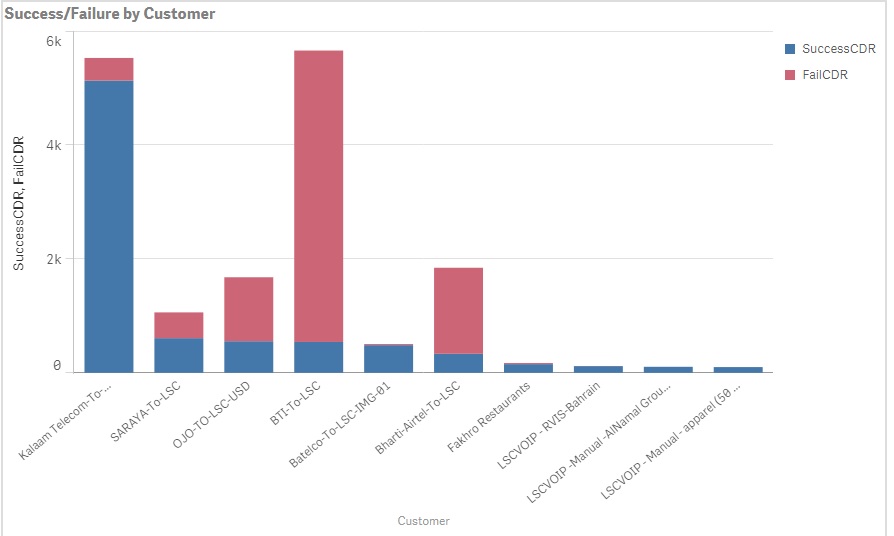
Hi, I have a stacked bar chart that has one dimension and two measures. the dimension is 'Customer' and the measures are 'SuccessCDR' and 'FailCDR', on the stacked bar chart, I want the 'SuccessCDR' to show as lightgreen() instead of blue and 'FailCDR' to show as lightred() instead of red.
Every example i have found is checking a value like
if(Type='Discussion',blue(),if(Type='Replies',Green(),Red()))
Except in my case there is no field value, I just want that measure to show up with a different color expression.
Something like this
if('SuccessCDR',green(),if('FailCDR',Red()))
How do i do this?
- « Previous Replies
-
- 1
- 2
- Next Replies »
- Mark as New
- Bookmark
- Subscribe
- Mute
- Subscribe to RSS Feed
- Permalink
- Report Inappropriate Content
You can colour a stacked bar chart in the following way. Take this as an Example.
Use these expressions:
Dimension 1: year-month
Dimension 2: valuelist( 'achieved', 'justmissed' and 'missed')
Measure : if(valuelist( 'achieved', 'justmissed' and 'missed') = 'achived',<expression1>,
if(valuelist( 'achieved', 'justmissed' and 'missed') = 'justmissed',<expression2>,
if(valuelist( 'achieved', 'justmissed' and 'missed') = 'missed',<expression3> )))
Colour Expression:
if(valuelist( 'achieved', 'justmissed' and 'missed') = 'achived',lightgreen(),
if(valuelist( 'achieved', 'justmissed' and 'missed') = 'justmissed',yellow(),
if(valuelist( 'achieved', 'justmissed' and 'missed') = 'missed',lightred() )))
Check this for a QVF sample.
- Mark as New
- Bookmark
- Subscribe
- Mute
- Subscribe to RSS Feed
- Permalink
- Report Inappropriate Content
Hi Sangram,
I want to color a stacked chart which is having "department name" as dimension and "Count(users), Count(divisions)" as measures.
I have tried doing it in color expression editor but no use.
Could you suggest me the way to do it?
Awaiting.
- Mark as New
- Bookmark
- Subscribe
- Mute
- Subscribe to RSS Feed
- Permalink
- Report Inappropriate Content
Sravanthi,
Does Sangram's solution work? If yes, can you mark the answer as correct?
- Mark as New
- Bookmark
- Subscribe
- Mute
- Subscribe to RSS Feed
- Permalink
- Report Inappropriate Content
No, It din't. I am just waiting for his reply.
- Mark as New
- Bookmark
- Subscribe
- Mute
- Subscribe to RSS Feed
- Permalink
- Report Inappropriate Content
That is the current available solution. Sangram's answer should be marked as correct.
cheers
- Mark as New
- Bookmark
- Subscribe
- Mute
- Subscribe to RSS Feed
- Permalink
- Report Inappropriate Content
I am unable to get it for the condition I have given above, could u pls suggest on my query
- Mark as New
- Bookmark
- Subscribe
- Mute
- Subscribe to RSS Feed
- Permalink
- Report Inappropriate Content
Hi
Please Attach qvf file and we will get it working
- Mark as New
- Bookmark
- Subscribe
- Mute
- Subscribe to RSS Feed
- Permalink
- Report Inappropriate Content
Hello,
This solution works for me thanks, but now I am having a hard time sorting the way I would like. I was wondering if anyone could inform me on how to sort numerically descending based on the second value represented in my value list while deploying this color scheme? I have tried a couple "sort by expression's" but non give me the desired result.
Thx
- Mark as New
- Bookmark
- Subscribe
- Mute
- Subscribe to RSS Feed
- Permalink
- Report Inappropriate Content
One way to achieve this is by creating a Master Item Measure for both of your measures. In creation of this measure you are able to select the color of your choice for each respective measure. Note that these colors will stay consistent throughout your app if you have them displayed in multiple sheets.
- Mark as New
- Bookmark
- Subscribe
- Mute
- Subscribe to RSS Feed
- Permalink
- Report Inappropriate Content
@adandreti, thank you for that!!
- « Previous Replies
-
- 1
- 2
- Next Replies »