Unlock a world of possibilities! Login now and discover the exclusive benefits awaiting you.
- Qlik Community
- :
- Forums
- :
- Analytics
- :
- New to Qlik Analytics
- :
- Re: Color by Expression - Line Chart and Pie Chart
- Subscribe to RSS Feed
- Mark Topic as New
- Mark Topic as Read
- Float this Topic for Current User
- Bookmark
- Subscribe
- Mute
- Printer Friendly Page
- Mark as New
- Bookmark
- Subscribe
- Mute
- Subscribe to RSS Feed
- Permalink
- Report Inappropriate Content
Color by Expression - Line Chart and Pie Chart
Hello,
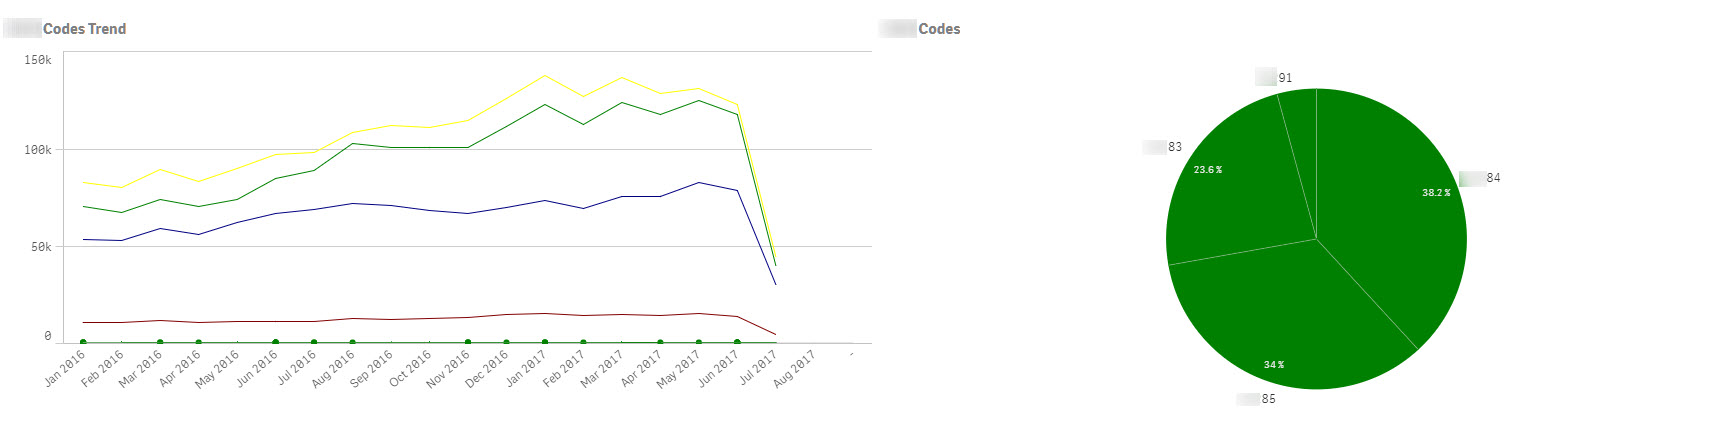
I have a line chart and a bar chart in which I want to use the same expression to color.
Below is the expression and a screen shot of the two charts.
Is there a reason that they pie chart colors wouldn't work?
IF([Code] = '91'
,red()
,IF ([Code] = '83'
,blue()
,If(
= '84'
,yellow()
,green()
)
)
)
- « Previous Replies
- Next Replies »
- Mark as New
- Bookmark
- Subscribe
- Mute
- Subscribe to RSS Feed
- Permalink
- Report Inappropriate Content
please try the same expression in the background color of the measure. it should work. for me its working.
- Mark as New
- Bookmark
- Subscribe
- Mute
- Subscribe to RSS Feed
- Permalink
- Report Inappropriate Content
Does Qlik Sense have "background colors of measures?"
- Mark as New
- Bookmark
- Subscribe
- Mute
- Subscribe to RSS Feed
- Permalink
- Report Inappropriate Content
Background color of measure is available in Table
- Mark as New
- Bookmark
- Subscribe
- Mute
- Subscribe to RSS Feed
- Permalink
- Report Inappropriate Content
Hi,
Might be this is possible because you match the values as a string. You wrote the values in a single quote. Remove that quote and it'll work for you.
F([Code] = 91
,red()
,IF ([Code] = 83
,blue()
,If(
= 84
,yellow()
,green()
)
)
)
Also, See the Code values which you compare.
Thanks,
Ishan
- Mark as New
- Bookmark
- Subscribe
- Mute
- Subscribe to RSS Feed
- Permalink
- Report Inappropriate Content
That field is a string field. Some of the values in that field have letters. The ones I am displaying do not, but other values do.
With that, I have tried both ways (with single quotes and without them) multiple times.
- Mark as New
- Bookmark
- Subscribe
- Mute
- Subscribe to RSS Feed
- Permalink
- Report Inappropriate Content
try instead of '='
use wildmatch() everywhere.
For ex:
IF(wildmatch([Code] ,'91'),
,red()
,IF (wildmatch([Code], 83),
,blue()
,If(wildmatch(
, 84),
,yellow()
,green()
)
)
)
- « Previous Replies
- Next Replies »