Unlock a world of possibilities! Login now and discover the exclusive benefits awaiting you.
- Qlik Community
- :
- Forums
- :
- Analytics
- :
- New to Qlik Analytics
- :
- Re: Color mix expression with if condition
- Subscribe to RSS Feed
- Mark Topic as New
- Mark Topic as Read
- Float this Topic for Current User
- Bookmark
- Subscribe
- Mute
- Printer Friendly Page
- Mark as New
- Bookmark
- Subscribe
- Mute
- Subscribe to RSS Feed
- Permalink
- Report Inappropriate Content
Color mix expression with if condition
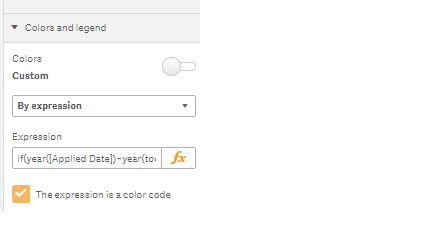
Hi I am trying to give a gradient color using if stmt and color mix func to a barchart iam working on. can i get some help here. I cant get the code right its not working for me.
if(year([Applied Date])=year(today()), colormix1(rank(total column(1))/noofrows(TOTAL), rgb(255, 0, 102), rgb(255, 204, 224)))
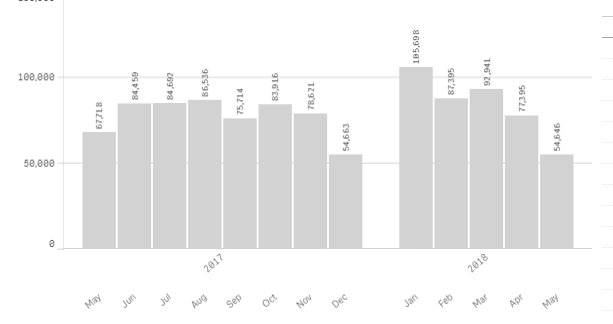
this is my data
| year([date field]) | month([date field]) | measure |
| 2017 | May | 67,718 |
| 2017 | Jun | 84,459 |
| 2017 | Jul | 84,692 |
| 2017 | Aug | 86,536 |
| 2017 | Sep | 75,714 |
| 2017 | Oct | 83,916 |
| 2017 | Nov | 78,621 |
| 2017 | Dec | 54,663 |
| 2018 | Jan | 105,698 |
| 2018 | Feb | 87,395 |
| 2018 | Mar | 92,941 |
| 2018 | Apr | 77,395 |
| 2018 | May | 54,646 |
thanks
Accepted Solutions
- Mark as New
- Bookmark
- Subscribe
- Mute
- Subscribe to RSS Feed
- Permalink
- Report Inappropriate Content
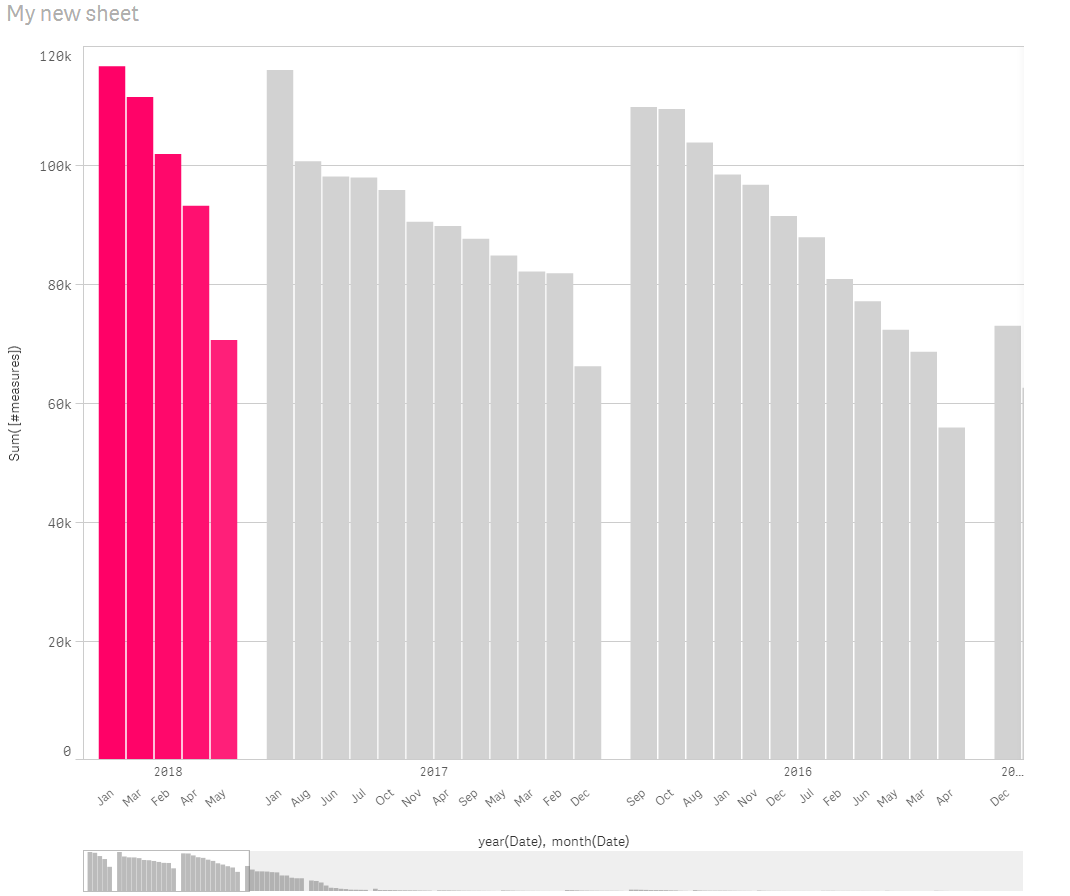
Try this
If(Year(Max(Date)) = Year(Today()), ColorMix1(Rank(TOTAL Sum([#measures]))/NoOfRows(TOTAL), RGB(255, 0, 102), RGB(255, 204, 224)))
- Mark as New
- Bookmark
- Subscribe
- Mute
- Subscribe to RSS Feed
- Permalink
- Report Inappropriate Content
Would you be able to share your qvf file to check this out and play around with a little bit?
- Mark as New
- Bookmark
- Subscribe
- Mute
- Subscribe to RSS Feed
- Permalink
- Report Inappropriate Content
HI Sunny, Iam working on the enterprise version. Let me create the qvf in desktop version and send it over.
- Mark as New
- Bookmark
- Subscribe
- Mute
- Subscribe to RSS Feed
- Permalink
- Report Inappropriate Content
Hi Sunny here is the qvf.
how ever in the actual app, I have a calculated measure to show 12 month rolling period. I assume it doesn't matter how iam using my measure calculation as long as you have workable chart and data?
let me know if this works. thanks for your time and help on this .
- Mark as New
- Bookmark
- Subscribe
- Mute
- Subscribe to RSS Feed
- Permalink
- Report Inappropriate Content
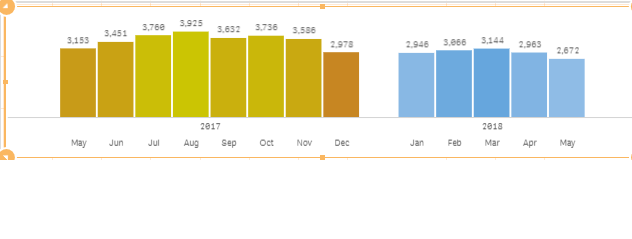
hi Sunny I am tying to give diff gradient color for each year .
if([date=year(today()), colormix1(rank(total column(1))/noofrows(TOTAL), rgb(255, 0, 102), rgb(255, 204, 224)),
if(date=year(today())-1,colormix1(rank(total column(1))/noofrows(TOTAL), rgb(204, 51, 0), rgb(255, 102, 51))))
- Mark as New
- Bookmark
- Subscribe
- Mute
- Subscribe to RSS Feed
- Permalink
- Report Inappropriate Content
Try this
If(Year(Max(Date)) = Year(Today()), ColorMix1(Rank(TOTAL Sum([#measures]))/NoOfRows(TOTAL), RGB(255, 0, 102), RGB(255, 204, 224)))
- Mark as New
- Bookmark
- Subscribe
- Mute
- Subscribe to RSS Feed
- Permalink
- Report Inappropriate Content
Hi Sunny thankyou for working on this. Re: Applying Color gradient for Bar Chart in Qliksense discussion helped be to understand the concept iam looking for.
in the code , we should also consider the number of dimensions we are using in our visual , it will do the trick.
the exact code i used in my actual app is
if([ Year]=year(today()), ColorMix2( (rank(total column(1))/(noofrows(TOTAL)/6))-1 ,rgb(0,112,200),rgb(142,180,227),rgb(198,217,241)),
if([Year]=year(today())-1,ColorMix2((rank(total column(1))/(noofrows(TOTAL)/6))-1,rgb(204, 204, 0), rgb(255, 255, 179),rgb(189,0,98))))
thanks again for looking into this.
- Mark as New
- Bookmark
- Subscribe
- Mute
- Subscribe to RSS Feed
- Permalink
- Report Inappropriate Content
Great  ... I am glad you figured it out. Please close the thread by marking correct and helpful responses.
Best,
Sunny