Unlock a world of possibilities! Login now and discover the exclusive benefits awaiting you.
- Qlik Community
- :
- Forums
- :
- Analytics
- :
- New to Qlik Analytics
- :
- Re: Colour the Range based on values
- Subscribe to RSS Feed
- Mark Topic as New
- Mark Topic as Read
- Float this Topic for Current User
- Bookmark
- Subscribe
- Mute
- Printer Friendly Page
- Mark as New
- Bookmark
- Subscribe
- Mute
- Subscribe to RSS Feed
- Permalink
- Report Inappropriate Content
Colour the Range based on values
Hi All,
I need your expertise on how i can colour min, max and average using my expression. Attached the table snapshot and what i am looking for.
My Measure to get number value and percentage togeether -
(count(distinct if([CTMP Local Days TIL Match Agreed T Or Greater]='Match Agreed Greater Than T+0' and [CTMP Match Status]='Matched',[CTMP Trade Side ID])) &'('&(round(count(distinct if([CTMP Local Days TIL Match Agreed T Or Greater]='Match Agreed Greater Than T+0' and [CTMP Match Status]='Matched',[CTMP Trade Side ID]))/count(TOTAL distinct {<[CTMP Local Days TIL Match Agreed T Or Greater]={'Match Agreed Greater Than T+0'},[CTMP Match Status]={'Matched'}>}[CTMP Trade Side ID]),0.0001))*100 &'%'&')')
Dimensions -
1) =if([CTMP Local Days TIL Match Agreed T Or Greater]='Match Agreed Greater Than T+0',left([CTMP Security Code],2))
2) =IF([CTMP Joint Touch Statement]<>('No Touch Cncl/Unmatched'),[CTMP Joint Touch Statement])
3) =[CTM FI Late]
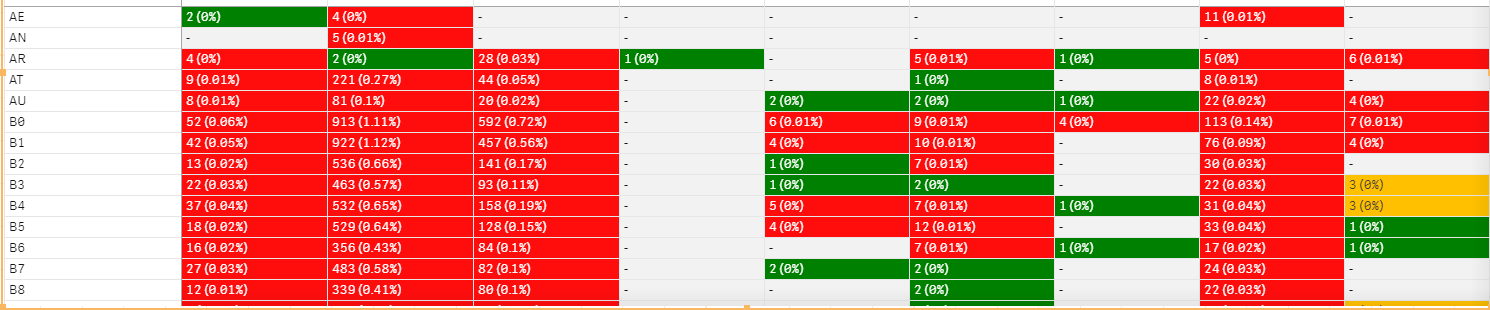
My current view of table below -

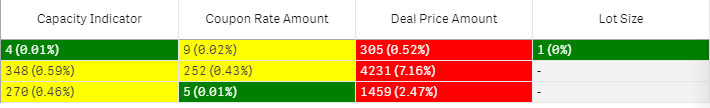
The below is the view i want to achieve -

Please check and advice.
Thanks in advance,
Richard
- « Previous Replies
-
- 1
- 2
- Next Replies »
- Mark as New
- Bookmark
- Subscribe
- Mute
- Subscribe to RSS Feed
- Permalink
- Report Inappropriate Content
You could try this for your top and bottom.
If(aggr(Rank((YOUREXPRESSION),YOURDIMENSION)=1
,'Red'
,If(aggr(Rank(-(YOUREXPRESSION),YOURDIMENSION=1
,'Green'
))
The average one is a bit trickier, I am playing with some of my own data to figure that one out. But, the above worked to color by min and max values in a column. You can use any CSS color shade name if you don't like those shades of red and green
- Mark as New
- Bookmark
- Subscribe
- Mute
- Subscribe to RSS Feed
- Permalink
- Report Inappropriate Content
Hi Steven,
Thanks for your time and support.
Well, i tried with different option like median. I think it works to an extent -
if(Count([CTM FI Late])>median(total aggr(Count([CTM FI Late]),[CTMP Joint Touch Statement],[CTMP Market Country],[CTM FI Late])),RGB(255,13,13),
if(Count([CTM FI Late])<median(total aggr(Count([CTM FI Late]),[CTMP Joint Touch Statement],[CTMP Market Country],[CTM FI Late])),green(),
if(Count([CTM FI Late])= median(total aggr(Count([CTM FI Late]),[CTMP Joint Touch Statement],[CTMP Market Country],[CTM FI Late])),RGB(255,192,0))))
Regards,
Richard
- Mark as New
- Bookmark
- Subscribe
- Mute
- Subscribe to RSS Feed
- Permalink
- Report Inappropriate Content
Did you need every cell to have a color like that? seems that the Min portion of that works, but only capturing a 0 value. The max seems to be coloring everything above the median value, which is what you told it to do. You could combine my suggestion and yours to get only the Max, Min and Median value cells to color if that is what you are trying to do!
- Mark as New
- Bookmark
- Subscribe
- Mute
- Subscribe to RSS Feed
- Permalink
- Report Inappropriate Content
Yes Steven, if you refer to my earlier screenshot every cell was color (green,red,etc) based on Min, Max and average value. Not sure if we can use a Colour scheme like that in Qliksense hence i tried to work around with median as an option.
- Mark as New
- Bookmark
- Subscribe
- Mute
- Subscribe to RSS Feed
- Permalink
- Report Inappropriate Content
Understood! I see that now, at first glance it looked like the numbers were the same.
You could try using fractile and split the data in thirds to get your top, bottom and middle. Something like this:
if(aggr(Rank(YOUREXPRESSION),YOURDIMENSION)
<= fractile(TOTAL aggr(Rank(YOUREXPRESSION),YOURDIMENSION), 0.33), 'Green',
if(aggr(Rank(YOUREXPRESSION),YOURDIMENSION)
<= fractile(TOTAL aggr(Rank(YOUREXPRESSION),YOURDIMENSION), 0.66), 'Yellow',
if(aggr(Rank(YOUREXPRESSION),YOURDIMENSION)
<= fractile(TOTAL aggr(Rank(YOUREXPRESSION),YOURDIMENSION), 1), 'Red')))
I just tried this in on a column in a pretty large data table similar to yours and it worked like a charm. You can adjust the .33,.66 and 1 to get the level of fractiles that you desire.
You could even set the fractile number up as a variable with input boxes on the sheet if you need it to remain dynamic.
- Mark as New
- Bookmark
- Subscribe
- Mute
- Subscribe to RSS Feed
- Permalink
- Report Inappropriate Content
@richard24best try below
if(YourExpression=median(total aggr(YourExpression,[CTMP Joint Touch Statement],[CTMP Market Country],[CTM FI Late])),RGB(255,13,13),
if(YourExpression=min(total aggr(YourExpression,[CTMP Joint Touch Statement],[CTMP Market Country],[CTM FI Late])),green(),
if(YourExpression= max(total aggr(YourExpression,[CTMP Joint Touch Statement],[CTMP Market Country],[CTM FI Late])),RGB(255,192,0))))
- Mark as New
- Bookmark
- Subscribe
- Mute
- Subscribe to RSS Feed
- Permalink
- Report Inappropriate Content
Not working Kush, Thanks for your time
if(Count([CTMP Amendment Reasons])=median(total aggr(Count([CTMP Amendment Reasons]),[CTMP Joint Touch Statement],[CTMP Market Country],[CTM FI Late])),RGB(255,13,13),
if(Count([CTMP Amendment Reasons])=min(total aggr(Count([CTMP Amendment Reasons]),[CTMP Joint Touch Statement],[CTMP Market Country],[CTM FI Late])),green(),
if(Count([CTMP Amendment Reasons])= max(total aggr(Count([CTMP Amendment Reasons]),[CTMP Joint Touch Statement],[CTMP Market Country],[CTM FI Late])),RGB(255,192,0))))
- Mark as New
- Bookmark
- Subscribe
- Mute
- Subscribe to RSS Feed
- Permalink
- Report Inappropriate Content
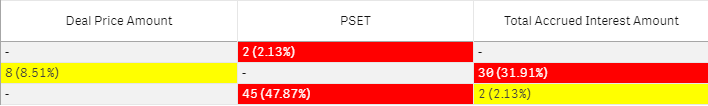
@Steven_Haught , when there is large nos it works fine but when i select a particlar client it shows incorrect.
Example of snapshot attached for your reference.
if you see no 2 is colored in red and yellow both .
Regards,
Richard
- Mark as New
- Bookmark
- Subscribe
- Mute
- Subscribe to RSS Feed
- Permalink
- Report Inappropriate Content
This is due to the Rank() being dynamic in the chart. I know we should be able to use Only() in conjunction with this but I am getting stuck on it...
@Kushal_Chawdaor @sunny_talwar I think I have read you guys work on a rank issue like this, any ideas?
- « Previous Replies
-
- 1
- 2
- Next Replies »