Unlock a world of possibilities! Login now and discover the exclusive benefits awaiting you.
- Qlik Community
- :
- Forums
- :
- Analytics
- :
- New to Qlik Analytics
- :
- Combo chart with two dimensions and 2 measures or ...
- Subscribe to RSS Feed
- Mark Topic as New
- Mark Topic as Read
- Float this Topic for Current User
- Bookmark
- Subscribe
- Mute
- Printer Friendly Page
- Mark as New
- Bookmark
- Subscribe
- Mute
- Subscribe to RSS Feed
- Permalink
- Report Inappropriate Content
Combo chart with two dimensions and 2 measures or other idea
Hi,
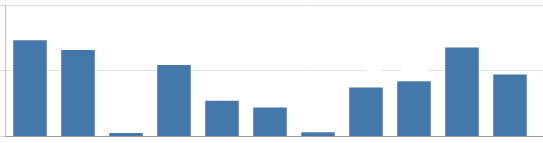
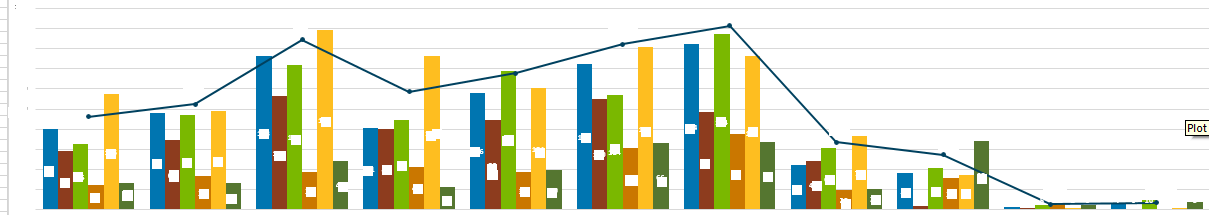
I am trying to combine two charts into one.The first chart is the totals for the answers selected for a question broken down into 6 sections (regions). The second chart is totals for the answers selected for a question (not broken down). Is there a way to combine these so the first chart stays the same with the non-broken down totals in a line on a secondary axis- I want it to look like pic 3 (an excel graph).
Thanks for the help!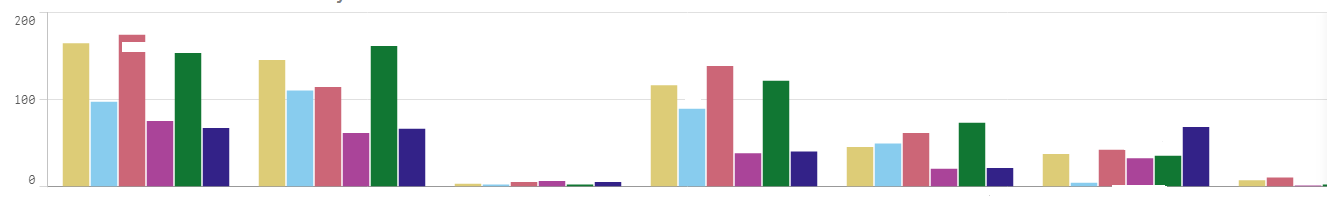
- Tags:
- help
- qlik sense
- Mark as New
- Bookmark
- Subscribe
- Mute
- Subscribe to RSS Feed
- Permalink
- Report Inappropriate Content
Hi Christopher,
You can have a max of 2 Dim and 1 measure / 1 Dim and 15 measures in a Bar or line chart.
But there is an alternative to achieve what you are looking for.
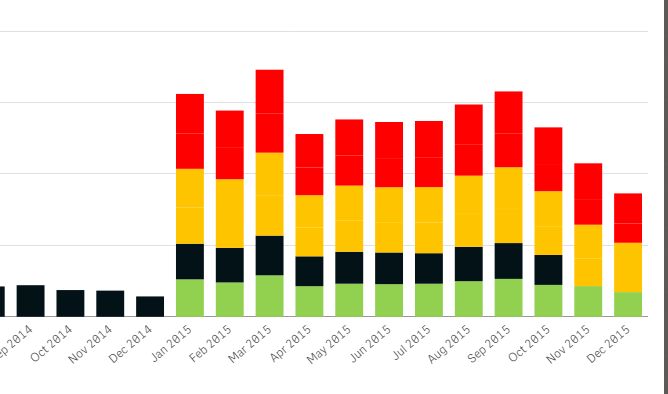
This bar chart has more than 4 measures plotted . Check the sample QVF attached for the procedure.
- Sangram Reddy
- Mark as New
- Bookmark
- Subscribe
- Mute
- Subscribe to RSS Feed
- Permalink
- Report Inappropriate Content
I appreciate the reply!
Unfortunately, the people to whom I am sending the charts do not like it stacked which is why I am trying to find a way to combine the charts. I should have mentioned that in the original post.
I have also looked at the dygraph extension but it has not worked with my data.
Thanks again!
- Mark as New
- Bookmark
- Subscribe
- Mute
- Subscribe to RSS Feed
- Permalink
- Report Inappropriate Content
No Problem!
As you have the leverage to build a visualisation for your self, I think it would help you meet your requirement.
-Sangram