Unlock a world of possibilities! Login now and discover the exclusive benefits awaiting you.
- Qlik Community
- :
- Forums
- :
- Analytics
- :
- New to Qlik Analytics
- :
- Comparing same number of months in a graph with th...
- Subscribe to RSS Feed
- Mark Topic as New
- Mark Topic as Read
- Float this Topic for Current User
- Bookmark
- Subscribe
- Mute
- Printer Friendly Page
- Mark as New
- Bookmark
- Subscribe
- Mute
- Subscribe to RSS Feed
- Permalink
- Report Inappropriate Content
Comparing same number of months in a graph with the help of dimensions
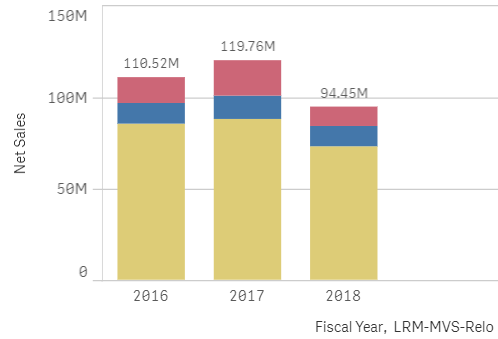
Hi, I have a graph as follows that shows the market share for products in terms of sales by the fiscal years 2016-2018.
But since 2018 is only in the 8th Month, I want to be able to compare the previous two years only upto 8 months and add this as an alternative dimension. Can someone help me with the code on this one? I have data across months called 'Fiscalmonth' and across Quarters as well called 'Fiscal Quarter'
Thanks a ton
Accepted Solutions
- Mark as New
- Bookmark
- Subscribe
- Mute
- Subscribe to RSS Feed
- Permalink
- Report Inappropriate Content
Hi Mallika,
What I think you should do :
- Create a new field, if not existing, in your calendar that is the monthnum of the date
num(month(date)) as NumMonth
- In the set analysis of your new measure, include Sum({< NumMonth = {" <= $(=num(month(Today())))"} >} >} [Sales])
Synthax must be inexact but I think that's the idea.
Hope it helps,
Regards,
Marina