Unlock a world of possibilities! Login now and discover the exclusive benefits awaiting you.
- Qlik Community
- :
- Forums
- :
- Analytics
- :
- New to Qlik Analytics
- :
- Concentration Histogram
Options
- Subscribe to RSS Feed
- Mark Topic as New
- Mark Topic as Read
- Float this Topic for Current User
- Bookmark
- Subscribe
- Mute
- Printer Friendly Page
Turn on suggestions
Auto-suggest helps you quickly narrow down your search results by suggesting possible matches as you type.
Showing results for
Anonymous
Not applicable
2018-08-24
02:37 PM
- Mark as New
- Bookmark
- Subscribe
- Mute
- Subscribe to RSS Feed
- Permalink
- Report Inappropriate Content
Concentration Histogram
Dear All,
I need to create a concentration histogram chart, which tells, by each supplier cluster, the percentage of the total number of product it has.
I have available the following table:
| Supplier | # Products |
|---|---|
| A | 200 |
| B | 150 |
| C | 105 |
| D | 100 |
| E | 90 |
| F | 80 |
| G | 70 |
I need to then cluster the suppliers due to its number of products. I mean: the first 1% suppliers (lets say only one in a total of 100 suppliers) is categorized as 'first 1%', the following falls in the 'from 1 to 20%' cluster and so on.
With so, I need to create the following chart:
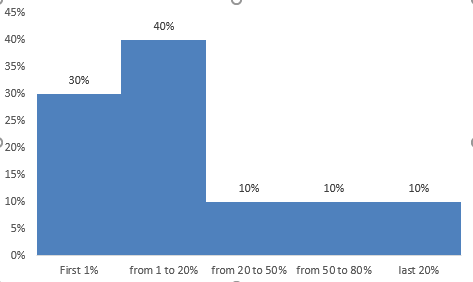
Has someone eveer done something like this?
0 Replies
Community Browser