Unlock a world of possibilities! Login now and discover the exclusive benefits awaiting you.
- Qlik Community
- :
- Forums
- :
- Analytics
- :
- New to Qlik Analytics
- :
- Re: Configuring the look of bar charts
- Subscribe to RSS Feed
- Mark Topic as New
- Mark Topic as Read
- Float this Topic for Current User
- Bookmark
- Subscribe
- Mute
- Printer Friendly Page
- Mark as New
- Bookmark
- Subscribe
- Mute
- Subscribe to RSS Feed
- Permalink
- Report Inappropriate Content
Configuring the look of bar charts
Hi,
I have a bar chart with a time dimension on a monthly basis. Saying this some months are missing in the data. I want to see those missing months in the chart.
I double checked the tab presentation and found a switch: continuous (I don't know exactly the english names since I use a german configured GUI). If I click on this I get this what I want (the gaps in the months) but the bars are really narrow and the continous month names on the x-axis is also missing.
Isn't there a possibility to configure the width of the bars as well as that every months is named on the x-axis? Please find attached a screenshot. The upper diagram is with continous switch off the lower diagram with continous switch set to automatic. I want to have the graph look like the lower chart.
- Mark as New
- Bookmark
- Subscribe
- Mute
- Subscribe to RSS Feed
- Permalink
- Report Inappropriate Content
No.
But, u do have a solution:
create a master calendar using the min max of ur date fields.
here's a way to do it:
https://community.qlik.com/t5/QlikView-Scripting/Creating-A-Master-Calendar/td-p/341286
Just copy and paste this script after loading the table containing ur date field.
change the highlighted fields with ur date field and ur table containing ur date field
Temp:

Load

               min(YourDateField) as minDate,

               max(YourDateField) as maxDate
Resident YourTable; Let varMinDate = Num(Peek('minDate', 0, 'Temp'));
 Let varMaxDate = Num(Peek('maxDate', 0, 'Temp'));
 DROP Table Temp;

TempCalendar:
 LOAD $(varMinDate) + Iterno()-1 As Num,
 Date($(varMinDate) + IterNo() - 1) as TempDate AutoGenerate 1 While $(varMinDate) + IterNo() -1 <= $(varMaxDate);

 MasterCalendar:
 Load TempDate AS YourDateField,
 week(TempDate) As Week,
 Year(TempDate) As Year,
 Month(TempDate) As Month,
 Day(TempDate) As Day,
 date(monthstart(TempDate), 'MMM-YYYY') as MonthYear //USE THIS FIELD
 Resident TempCalendar Order By TempDate ASC;
Drop Table TempCalendar;
Now, in ur chart, u can use the MonthYear field that'll contain all of ur months
- Mark as New
- Bookmark
- Subscribe
- Mute
- Subscribe to RSS Feed
- Permalink
- Report Inappropriate Content
thanks for that. I tried it (watched also the video) but the script is not loading. As soon as I use my field (it's loaded with spaces: "Datum Produktion Tag") and load the script again it says it can't find the field. Any hints, why?
- Mark as New
- Bookmark
- Subscribe
- Mute
- Subscribe to RSS Feed
- Permalink
- Report Inappropriate Content
do u call the table that contains ur date field?
The resident part?
- Mark as New
- Bookmark
- Subscribe
- Mute
- Subscribe to RSS Feed
- Permalink
- Report Inappropriate Content
I thought, I did. But I have loaded two tables which have the same name:
FROM [lib://xxx\file1.xlsx]
(ooxml, embedded labels, table is default);
FROM [lib://xxx\file2.xlsx]
(ooxml, embedded labels, table is default);
Both tables are created in Knime therefore I can't change the tab's name. - it's simply default. QlikSense resolves the table names internally to default and default-1. If I use default in the resident part, my field is not found, if I use default-1 QlikSense throws another error that the minus sign is not allowed.
- Mark as New
- Bookmark
- Subscribe
- Mute
- Subscribe to RSS Feed
- Permalink
- Report Inappropriate Content
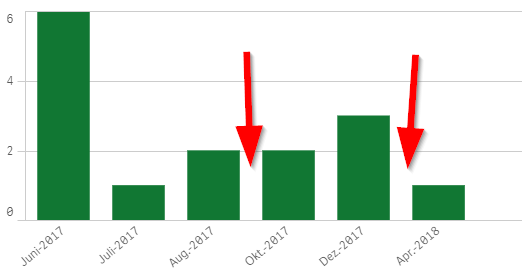
Hi again,
I managed to include your script successful now. Nevertheless, the gaps are still not shown for months where the value is 0. Please see the attached screenshot.
Any help on this?