Unlock a world of possibilities! Login now and discover the exclusive benefits awaiting you.
- Qlik Community
- :
- Forums
- :
- Analytics
- :
- New to Qlik Analytics
- :
- Constant value in dimension chart
- Subscribe to RSS Feed
- Mark Topic as New
- Mark Topic as Read
- Float this Topic for Current User
- Bookmark
- Subscribe
- Mute
- Printer Friendly Page
- Mark as New
- Bookmark
- Subscribe
- Mute
- Subscribe to RSS Feed
- Permalink
- Report Inappropriate Content
Constant value in dimension chart
Hi,
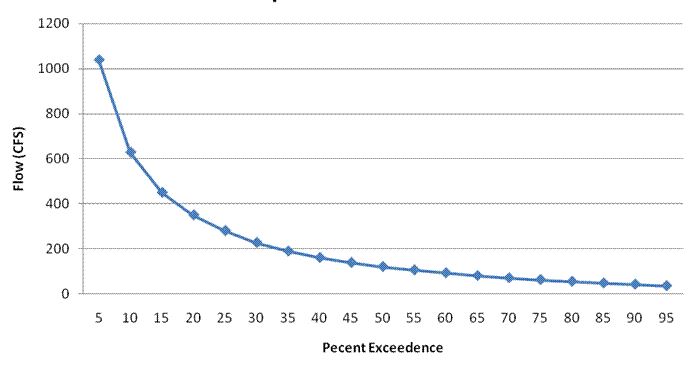
I am a very new user of Qlik Sense. Right now I am working on a way to create a Duration curve chart (something similar to this : http://hydrofuture.weebly.com/uploads/2/6/8/5/26855805/sfdasd.jpg). To do so, I am following this tutorial : OSU Streamflow Tutorial - Flow Duration Analysis.
The problem that I have is that I want to create a line chart with the following dimension :
100*(aggr(Rank(Measure,1,1),Dimension))/(XXXXXX+1)
And I want the XXXXXX to be the maximal rank of my measures. It is supposed to be, for a given selection with my filter panes, a constant value. However, I have tried few things and I've observed that having a constant expression in a chart dimension seems to be impossible. For example, I can't choose max(aggr(Measure,Dimension)) as a chart dimension. So is it possible to compute XXXXXX to be the maximal rank of my measure (so the rank of the lowest value of my measure) such as it is a constant value for a given selection ?
Best regards,
- Tags:
- chart dimensions