Unlock a world of possibilities! Login now and discover the exclusive benefits awaiting you.
- Qlik Community
- :
- Forums
- :
- Analytics
- :
- New to Qlik Analytics
- :
- Coordinates on maps: (lat, lon) to (lon, lat)
- Subscribe to RSS Feed
- Mark Topic as New
- Mark Topic as Read
- Float this Topic for Current User
- Bookmark
- Subscribe
- Mute
- Printer Friendly Page
- Mark as New
- Bookmark
- Subscribe
- Mute
- Subscribe to RSS Feed
- Permalink
- Report Inappropriate Content
Coordinates on maps: (lat, lon) to (lon, lat)
Hi all,
I'm trying to read a csv file with a column called linkPoints that looks like this:
40.74047,-74.009251 40.74137,-74.00893 40.7431706,-74.008591 40.7462304,-74.00797 40.74812
My plan was to load it using:
LOAD '[[' & replace(linkPoints,' ','],[') & ']]' as linkGeometry,
However, the problem seems to be that the linkPoints column has the points in lat lon format instead of lon lat.
Is there any workaround to get the lines displayed in Qlik? Can I somehow flip latitude and longitude?
Thanks
- Subscribe by Topic:
-
coordinates
-
GeoAnalytics
-
latitude
-
longitude
-
Qlik Sense
-
Qlik Sense Maps
- Mark as New
- Bookmark
- Subscribe
- Mute
- Subscribe to RSS Feed
- Permalink
- Report Inappropriate Content
Hello, this is an interesting problem. I think I have a solution for you, or something close to it.
We just need to break this problem down into chunks.
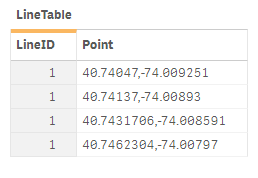
- CSV contains a field with several lat, lon value pairs delimited by a space. Let's first break that down into individual rows with the SubField function as a preceding load on your CSV.
Load
LineID,
SubField(Points,' ') as Point;
- Next we need to split up this lat lon format into two separate fields. Additionally, Now would also be a great time to give ourselves a sequence field.
Load
LineID,
SubField(Point,',',1) as lat,
SubField(Point,',',2) as lon,
if(Previous(LineID) = LineID, peek(SequenceID) + 1, 1) as SequenceID;
Load
LineID,
SubField(Points,' ') as Point;
- Lat and Lon are great, but lets convert them into a single "geopoint" value.
Load
LineID,
SequenceID,
GeoMakePoint(lat,lon) as GeoPoint;
Load
LineID,
SubField(Point,',',1) as lat,
SubField(Point,',',2) as lon,
if(Previous(LineID) = LineID, peek(SequenceID) + 1, 1) as SequenceID;
Load
LineID,
SubField(Points,' ') as Point;
- Lastly, for best performance, let's convert these points into a single Line Geometry value.
Below is the total script to do this from start to finish. Some preceding load steps could be combined, but I wanted to show the flow of logic to get to the end result. *I used an inline load rather that a CSV for my example script.
LineTable:
Load
LineID,
'[' & Concat(GeoPoint,',', SequenceID) & ']' as LineGeometry
Group By LineID;
Load
LineID,
SequenceID,
GeoMakePoint(lat,lon) as GeoPoint;
Load
LineID,
SubField(Point,',',1) as lat,
SubField(Point,',',2) as lon,
if(Previous(LineID) = LineID, Peek(SequenceID) + 1, 1) as SequenceID;
Load
LineID,
SubField(Points,' ') as Point;
Load
*
Inline [
LineID| Points
1| 40.74047,-74.009251 40.74137,-74.00893 40.7431706,-74.008591 40.7462304,-74.00797
](delimiter is |);
- Finally we are ready to plot the line on the map. Make sure to choose Line geometry in the location settings for Line layer in the map chart.
I'm sure there are other ways to deal with this. This post by @Patric_Nordstrom describes another method.
https://community.qlik.com/t5/Qlik-GeoAnalytics-Documents/From-Points-into-Lines/ta-p/1481413
I hope this helped.


