Unlock a world of possibilities! Login now and discover the exclusive benefits awaiting you.
- Qlik Community
- :
- Forums
- :
- Analytics
- :
- New to Qlik Analytics
- :
- Count days in row when measure is grater than 0
- Subscribe to RSS Feed
- Mark Topic as New
- Mark Topic as Read
- Float this Topic for Current User
- Bookmark
- Subscribe
- Mute
- Printer Friendly Page
- Mark as New
- Bookmark
- Subscribe
- Mute
- Subscribe to RSS Feed
- Permalink
- Report Inappropriate Content
Count days in row when measure is grater than 0
Qlik experts,
I would like to count days in row where the measure is grater greater than zero.
When a day is lower than zero, the count should be restarted so that the KPI is only showing days in row when the measure is greater than zero.
I need help to create a new set analysis that will count the days in row with a measure greater than zero. This should be used in a KPI.
Here is the set analysis I currently use for count days with measure greater than 0. This set analysis returns days with a measure greater than zero for entire 2018. Is it possible to restart the count if one day has a measure lower or = to zero?
count({$<[Vaerdata.Verdi]={">0"}, ElementID={'RR'},Year= {'2018'}>} [Vaerdata.Verdi])
Cheers,
Helge
- Tags:
- set analysis*
- « Previous Replies
-
- 1
- 2
- Next Replies »
- Mark as New
- Bookmark
- Subscribe
- Mute
- Subscribe to RSS Feed
- Permalink
- Report Inappropriate Content
Are you using a chart? That set analysis should only be providing you with 1 or null values for each rows.
If this is not what you want, please provide some sample data and I would be willing to help.
Regards,
- Mark as New
- Bookmark
- Subscribe
- Mute
- Subscribe to RSS Feed
- Permalink
- Report Inappropriate Content
I need help to create a new set analysis that will count the days in row with a measure greater than zero. This should be used in a KPI.
The set analysis shown above will only give 0 or 1. I added this here so that you can see the input that I need to include in the new set analysis.
Unfortunately I can not share a sample app.
Thanks
- Mark as New
- Bookmark
- Subscribe
- Mute
- Subscribe to RSS Feed
- Permalink
- Report Inappropriate Content
Try something like the below:
Aggr(count({$<[Vaerdata.Verdi]={">0"}, ElementID={'RR'},Year= {'2018'}>} [Vaerdata.Verdi]),[Vaerdata.Verdi])
- Mark as New
- Bookmark
- Subscribe
- Mute
- Subscribe to RSS Feed
- Permalink
- Report Inappropriate Content
Thanks for your suggestion, but unfortunately it does not work. The KPI returns a -
- Mark as New
- Bookmark
- Subscribe
- Mute
- Subscribe to RSS Feed
- Permalink
- Report Inappropriate Content
I just replicated it and it works fine on my side. Like the below :
count({<Vaerdata.Verdi = {">0"},Year = {2018},ElementID = {'RR'}>}Vaerdata.Verdi)
I suspect it could have something to do with your formatting, are you sure the Vaerdata.Verdi field is numerical?
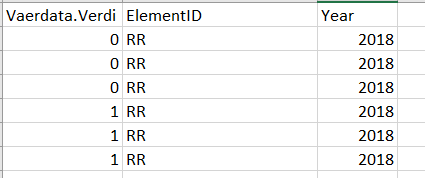
Also , Does your data look like the below:
- Mark as New
- Bookmark
- Subscribe
- Mute
- Subscribe to RSS Feed
- Permalink
- Report Inappropriate Content
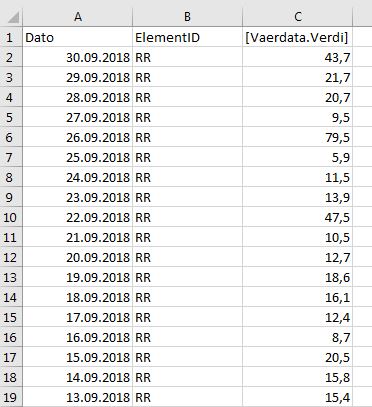
I have attached an excel-file to the original post.
I believe that the data is formatted as numerical. There is only numerical data in that row. How can I double check that is set to be numerical?
The data-source looks like this (the column vaerdata.verdi also contains values of 0,0 😞
- Mark as New
- Bookmark
- Subscribe
- Mute
- Subscribe to RSS Feed
- Permalink
- Report Inappropriate Content
The formula i provides would still work, your values are numerical so it should be fine, however, do you have a year field?
Otherwise you would need to add the below to your script:
Right(Dato,4) as Year
Alternatively just change the set analysis to the below:
=count({<ElementID = {'RR'},Vaerdata.Verdi = {">0"},Dato = {"=Right(Dato,4) = 2018"}>}Vaerdata.Verdi)
- Mark as New
- Bookmark
- Subscribe
- Mute
- Subscribe to RSS Feed
- Permalink
- Report Inappropriate Content
Thanks for all your help, Ruan.
I use a master calendar, so Year is included.
I still get the same results in the KPI. I don't understand what's wrong. It works fine when the aggr is not included. See picture below.
.JPG)
- Mark as New
- Bookmark
- Subscribe
- Mute
- Subscribe to RSS Feed
- Permalink
- Report Inappropriate Content
Thats the correct amount based on the test file.
Was amount are you expecting to find?
- « Previous Replies
-
- 1
- 2
- Next Replies »