Unlock a world of possibilities! Login now and discover the exclusive benefits awaiting you.
- Qlik Community
- :
- Forums
- :
- Analytics
- :
- New to Qlik Analytics
- :
- Re: Counting only the last distinct value
- Subscribe to RSS Feed
- Mark Topic as New
- Mark Topic as Read
- Float this Topic for Current User
- Bookmark
- Subscribe
- Mute
- Printer Friendly Page
- Mark as New
- Bookmark
- Subscribe
- Mute
- Subscribe to RSS Feed
- Permalink
- Report Inappropriate Content
Counting only the last distinct value
Hi everybody,
I created a Dashboard in Qlik Sense with a Pivotchart. The Pivotchart has as rows the Dates (a Drilldown Month-Date) and as the colums the Projects. The key figure is a basic "count(distinct [Task #])" and this works (mostly) fine. My problem is, since every project has multiple Task #, and every Task # can exist multiple times and on multiple dates, the count is only correct if every instance of the Task # is in the same Dateclass (e.g. in March). If I go a level deeper (Date) the count of Task # increases because the instances aren't in the same Dateclass anymore.
Is it possible to count only the last instance of the Task #?
The Raw Data looks like this:
| Date | Task # | Project |
| 02.03.2017 | 697273 | Project1 |
| 03.03.2017 | 697273 | Project1 |
| 03.03.2017 | 697069 | Project1 |
| 03.03.2017 | 697069 | Project1 |
| 03.03.2017 | 697294 | Project1 |
| 03.03.2017 | 697186 | Project1 |
As you see, if the Dateclass is "March", there are 4 distinct Task #, but if its on a Date level its 1 on the 02.03. and 4 on the 03.03. I want to count only the last one, so 0 on the 02.03. and 4 on the 03.03. so that it sums up correctly.
Thank you in advance for your help!
Accepted Solutions
- Mark as New
- Bookmark
- Subscribe
- Mute
- Subscribe to RSS Feed
- Permalink
- Report Inappropriate Content
May be try this as your expression:
=Count(DISTINCT Aggr(If(Max(TOTAL <[Task #]> Date) = Date, [Task #]), [Task #], Date))
- Mark as New
- Bookmark
- Subscribe
- Mute
- Subscribe to RSS Feed
- Permalink
- Report Inappropriate Content
May be try this as your expression:
=Count(DISTINCT Aggr(If(Max(TOTAL <[Task #]> Date) = Date, [Task #]), [Task #], Date))
- Mark as New
- Bookmark
- Subscribe
- Mute
- Subscribe to RSS Feed
- Permalink
- Report Inappropriate Content
Thank you very much, thats the solution!
- Mark as New
- Bookmark
- Subscribe
- Mute
- Subscribe to RSS Feed
- Permalink
- Report Inappropriate Content
Hi Sunny,
Would you please explain your expression a little bit, I have the same issue where I need to only count the distinct last rows based on a date column...but ironically your expression doesn't seem to work.
My columns are :
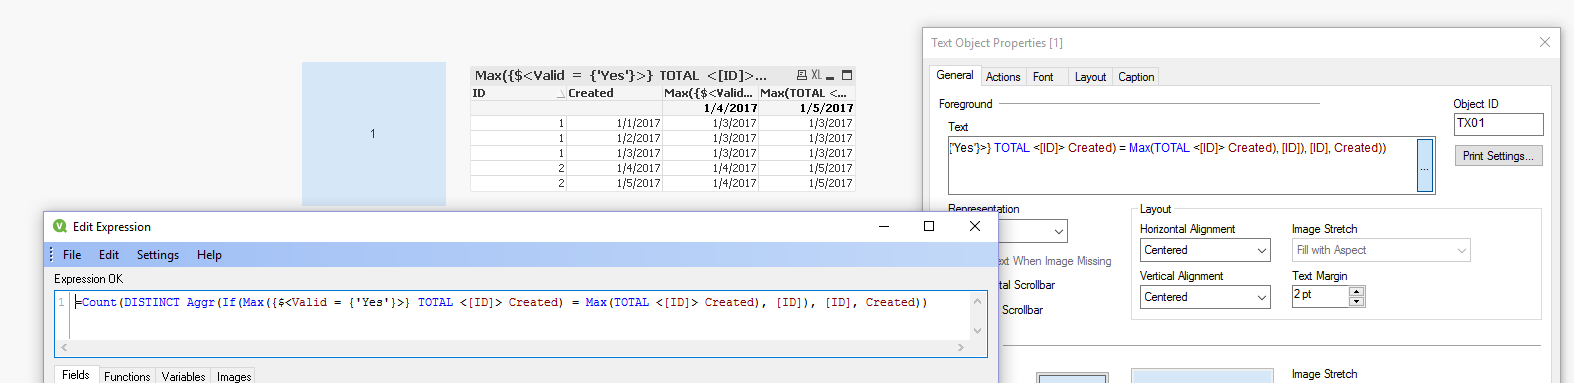
In the below table, I need to count the number of distinct IDs which are valid. In this case, the result should be only 1. Because there is only one ID in which its last row is valid.
ID Created Valid
1 2017-01-01 Yes
1 2017-01-02 Yes
1 2017-01-03 Yes
2 2017-01-04 Yes
2 2017-01-05 No
I used this expression, but it only shows a Dash as a result ( - )
=Count({$<Valid={'Yes'}>}DISTINCT Aggr(If(Max(TOTAL <[ID]> Created ) = Date, [ID), [ID], Created ))
- Mark as New
- Bookmark
- Subscribe
- Mute
- Subscribe to RSS Feed
- Permalink
- Report Inappropriate Content
Seems like you have some typos (fixed in red)
=Count({$<Valid = {'Yes'}>} DISTINCT Aggr(If(Max(TOTAL <[ID]> Created) = Created, [ID]), [ID], Created))
or try this
=Count(DISTINCT Aggr(If(Max({$<Valid = {'Yes'}>} TOTAL <[ID]> Created) = Created, [ID]), [ID], Created))
- Mark as New
- Bookmark
- Subscribe
- Mute
- Subscribe to RSS Feed
- Permalink
- Report Inappropriate Content
Thanks, Sunny
Unfortunately, it still shows nothing
Do you have any idea why?
- Mark as New
- Bookmark
- Subscribe
- Mute
- Subscribe to RSS Feed
- Permalink
- Report Inappropriate Content
Try this 
=Count(DISTINCT Aggr(If(Max({$<Valid = {'Yes'}>} TOTAL <[ID]> Created) = Max(TOTAL <[ID]> Created), [ID]), [ID], Created))
- Mark as New
- Bookmark
- Subscribe
- Mute
- Subscribe to RSS Feed
- Permalink
- Report Inappropriate Content
You're just unbelievably kind, thank you so much
I guess the problem is something else, the ID column is common between three different tables. How can I count the distinct IDs in one specific table?
for Created or Valid columns, I can refer them with their table names. like TableA.Created or TableB.Valid. But ID is not qualified to connect the tables.
- Mark as New
- Bookmark
- Subscribe
- Mute
- Subscribe to RSS Feed
- Permalink
- Report Inappropriate Content
May be create flags in the script when you are loading your data. Something like this...
TableA:
LOAD YourStuff,
'TableA' as Flag
FROM ....;
TableB:
....
'TableB' as Flag
....
and so on....
and then may be like this
=Count(DISTINCT Aggr(If(Max({$<Valid = {'Yes'}, Flag = {'TableA'}>} TOTAL <[ID]> Created) = Max({<Flag = {'TableA'}>}TOTAL <[ID]> Created), [ID]), [ID], Created))
- Mark as New
- Bookmark
- Subscribe
- Mute
- Subscribe to RSS Feed
- Permalink
- Report Inappropriate Content
Wow, awesome.
Thanks Mate